
Data Visualization Consulting
Data Visualization Consulting
Democratizing access to your company data is a great idea. The execution of it is hard:
- Data is in silos.
- Permissions need to be addressed.
- Intuitive dashboards need to be built.
- Executives & teams need to be trained.
- Adoption is a game of attrition.
Where do you even start? With experienced technical leadership who can lead projects and execute on deliverables.
That's exactly what our data visualization consulting packages provide. From platform experts, to enterprise architects and CISOs, we know how to deliver tangible value and results your c-suite will love. What are you waiting for? Setup your initial consultation by contacting us.

Thank you for getting in touch!
We will get back to you as soon as possible
(usually within one work day).
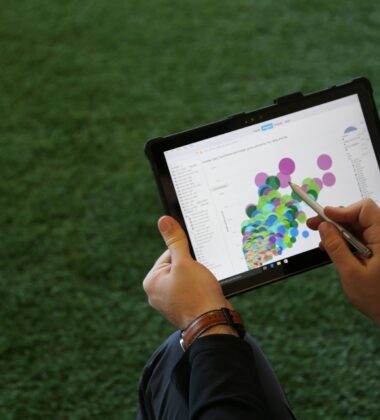
How Can Our Data Visualization Experts Help You Today?
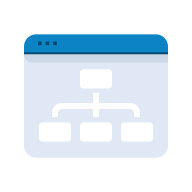
Data Visualization

ETL
Data Strategy and Assessment
Data Integration and ETL
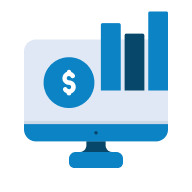
Dashboard and Report Development

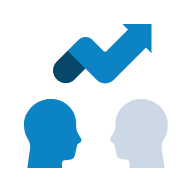
Advanced Analytics and Insights
Setup & Adminstration
Fractional Data Team
How Can Our Data Visualization Experts Help You Today?


Data Visualization
ETL
Data Strategy and Assessment
Data Integration and ETL
Dashboard and Report Development
Advanced Analytics and Insights
Setup & Adminstration
Fractional Data Team
The most impressive thing about Three Ventures is the breath of knowledge, not just about data visualization, but the overarching concepts (data warehousing, ETL, KB8, security) surrounding the implementation of it. Additionally, the staffing was enough to solve the issues on the shortened time scale without negatively affecting the budget!


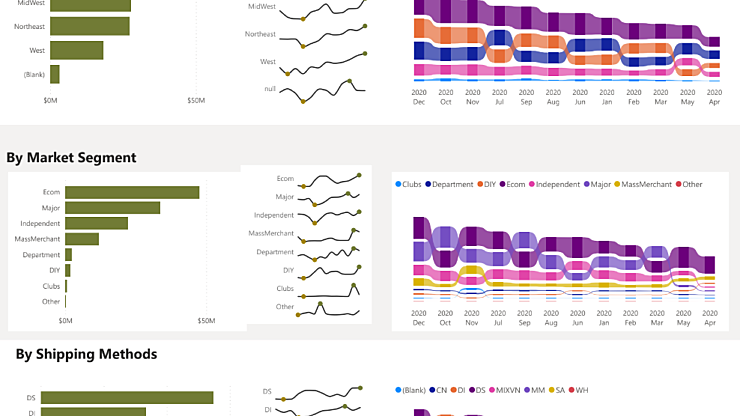
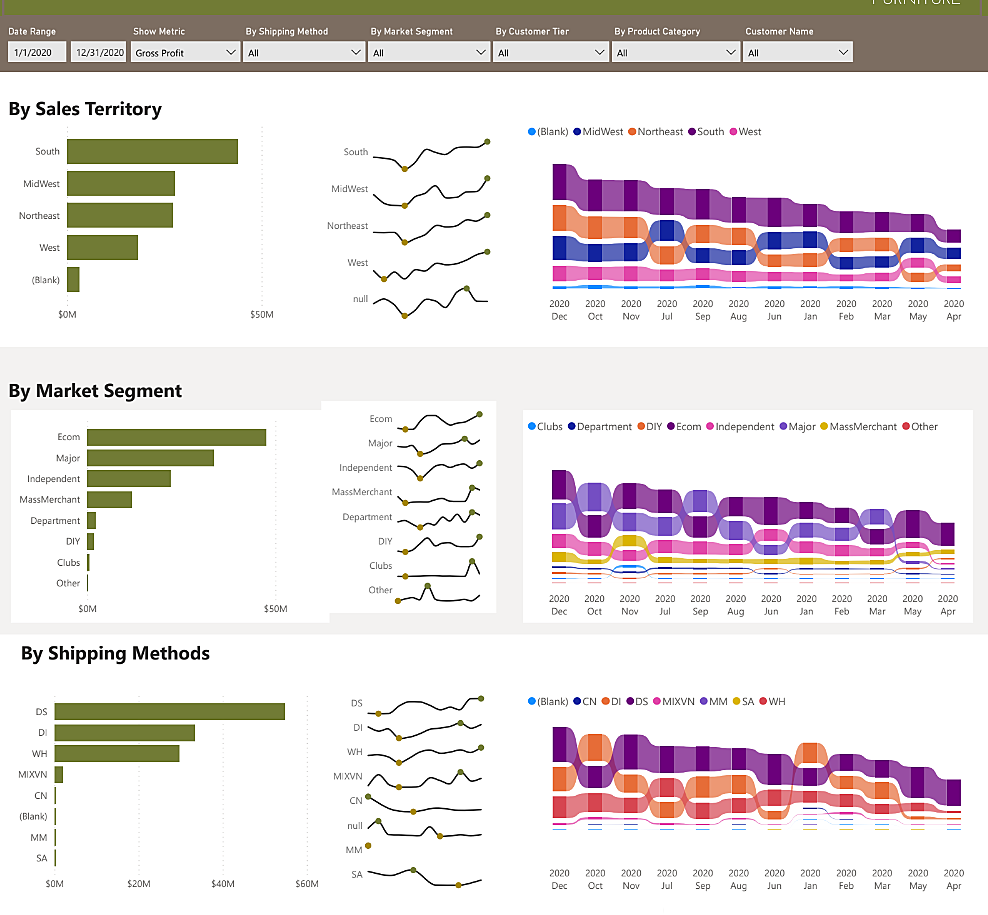
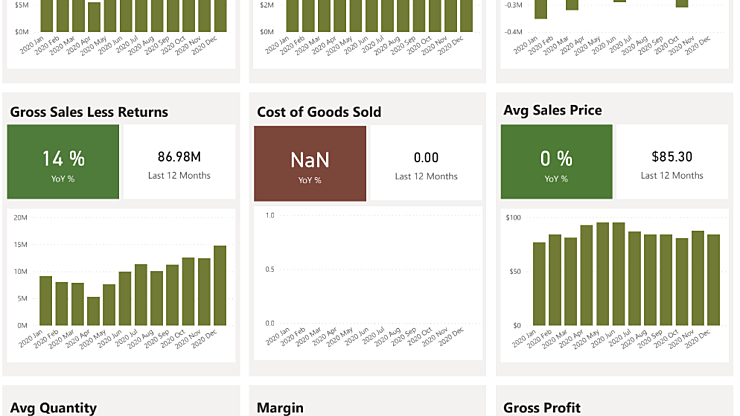
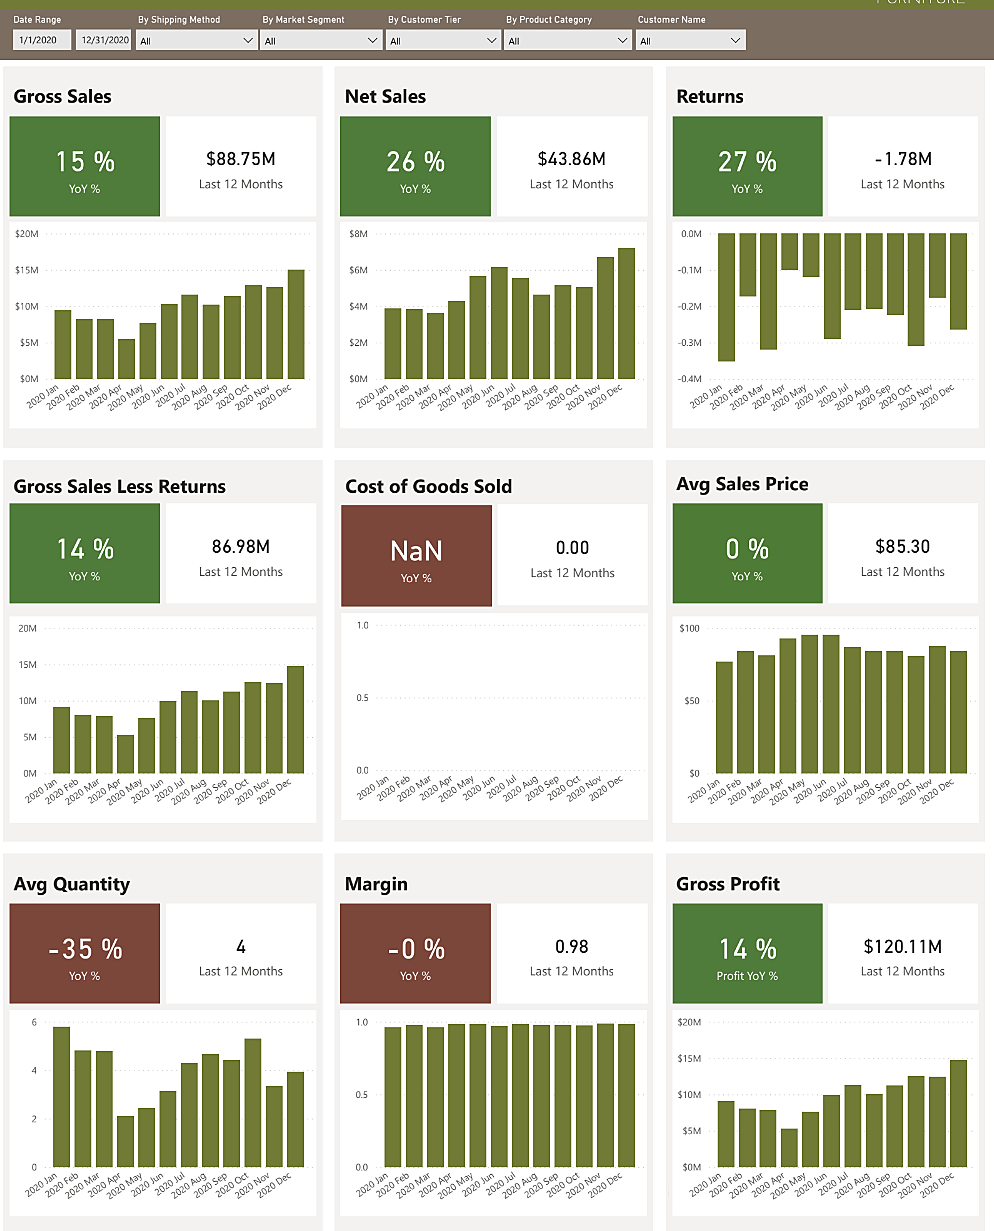
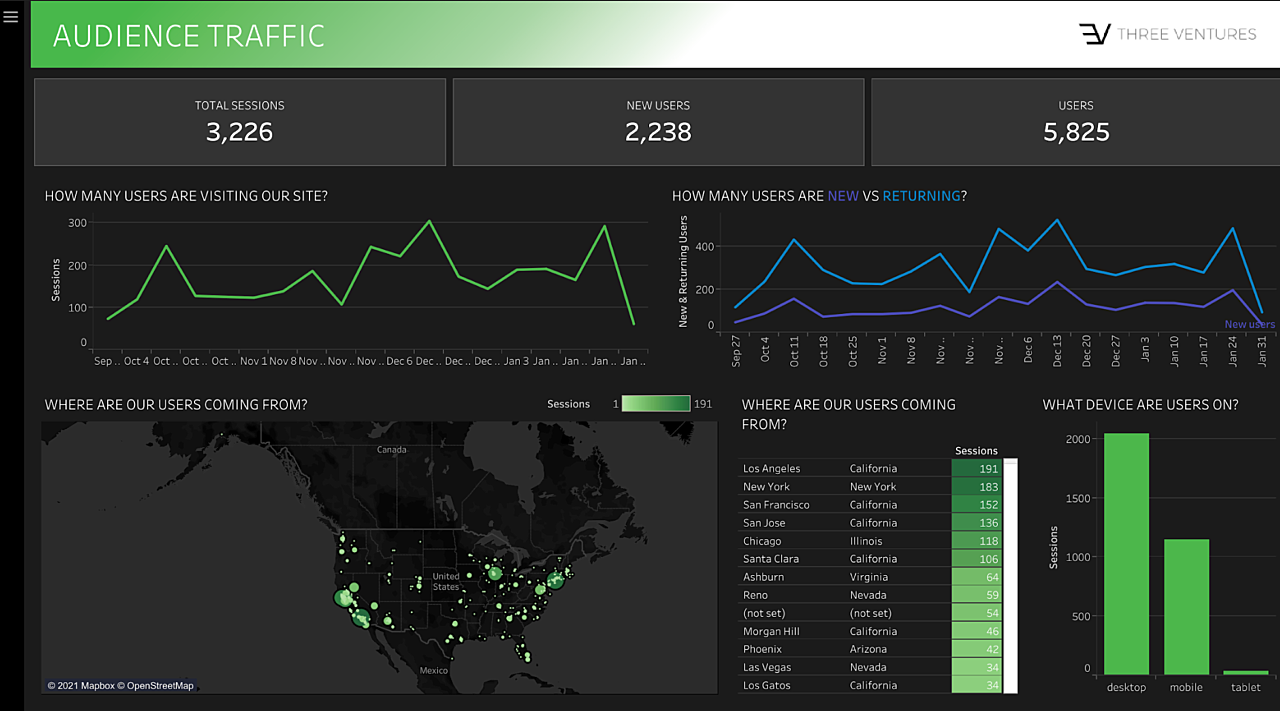
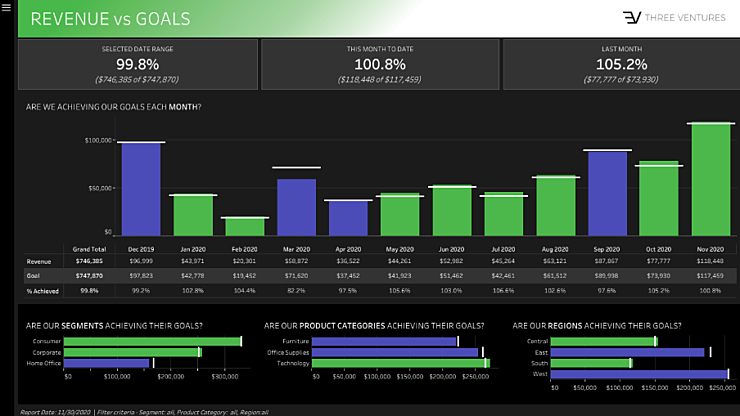
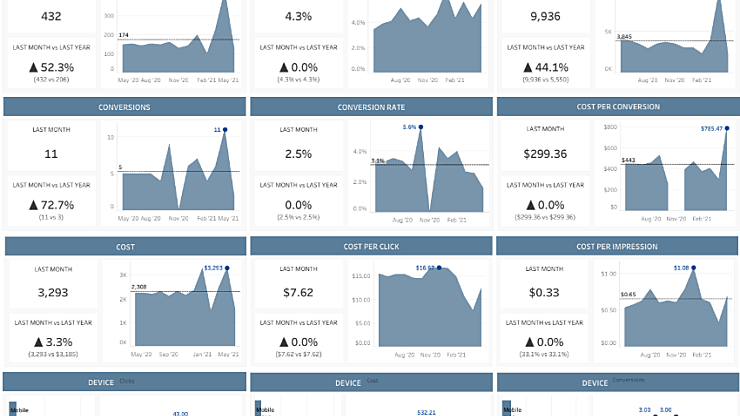
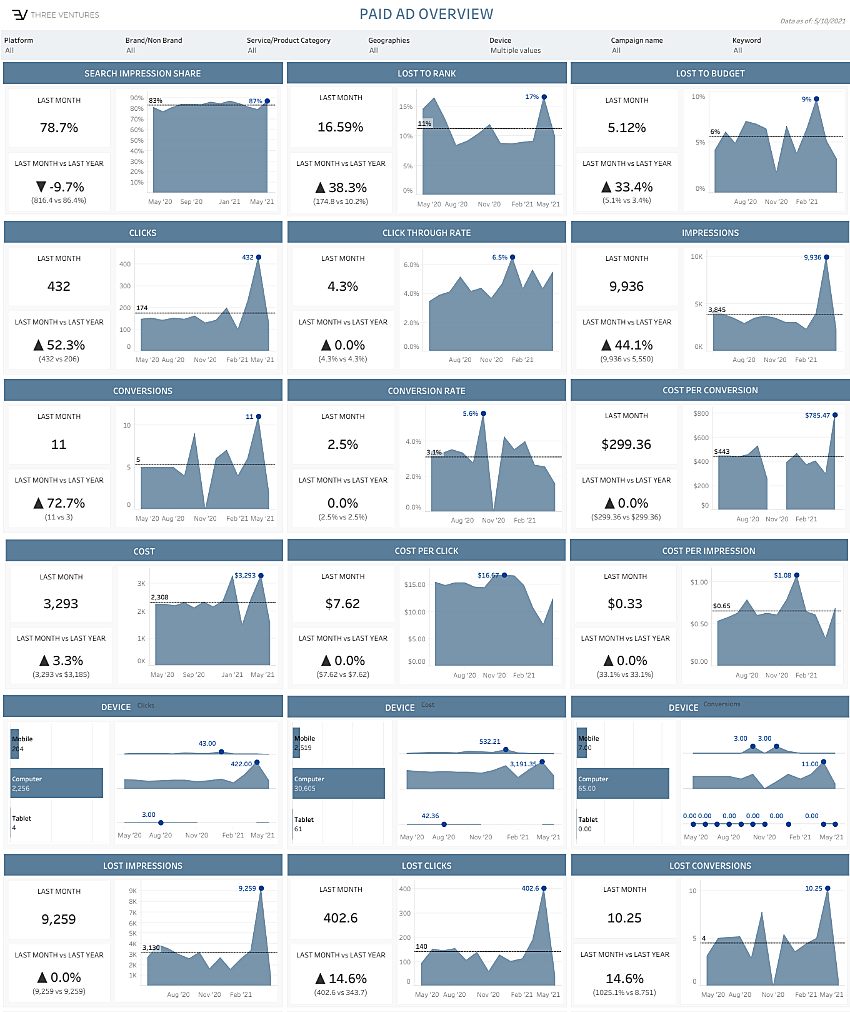
Portfolio


Ready to Organize Your Data Into Storytelling Dashboards and Reports?


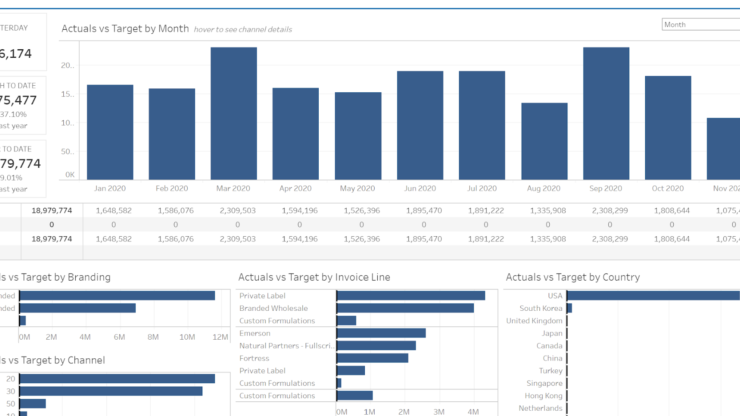
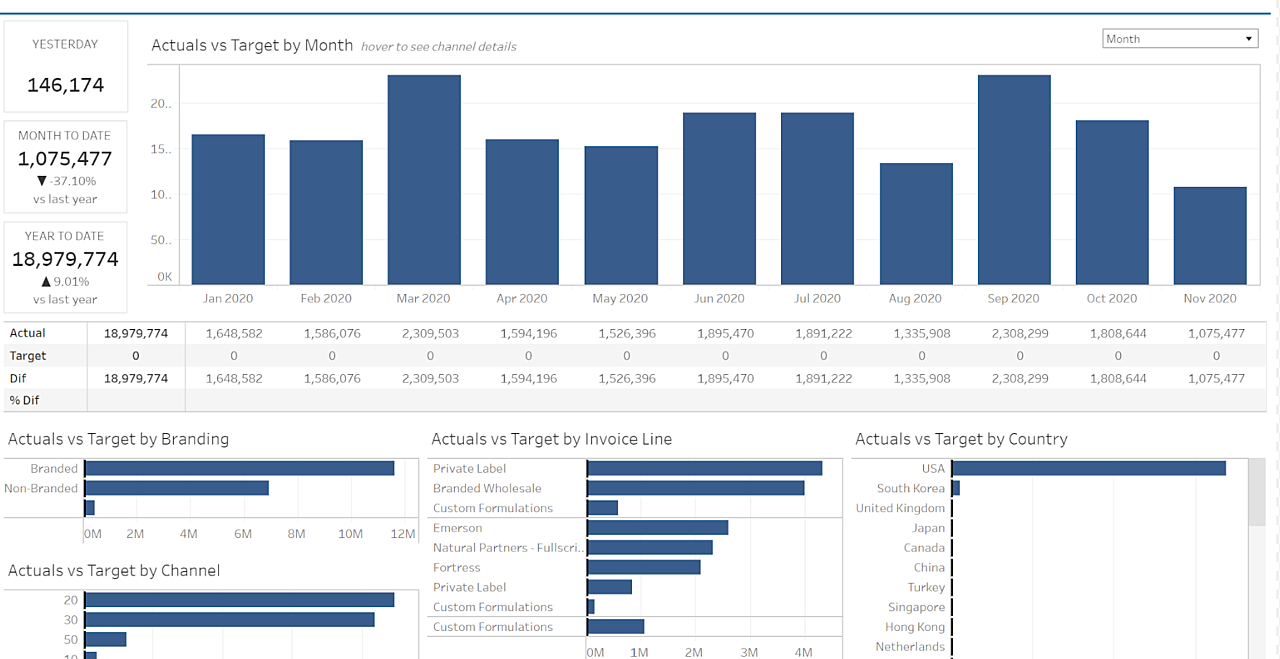
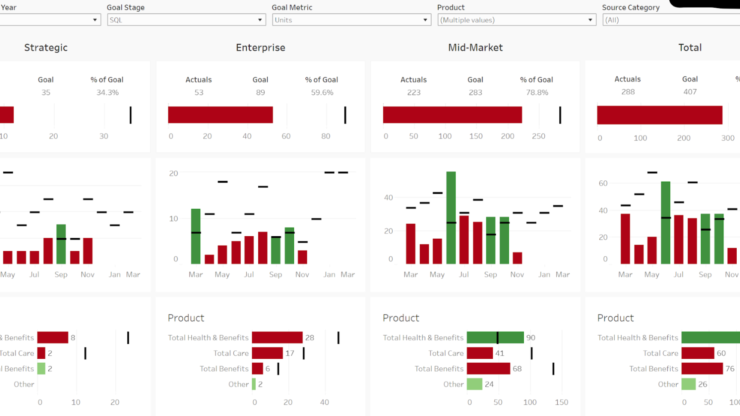
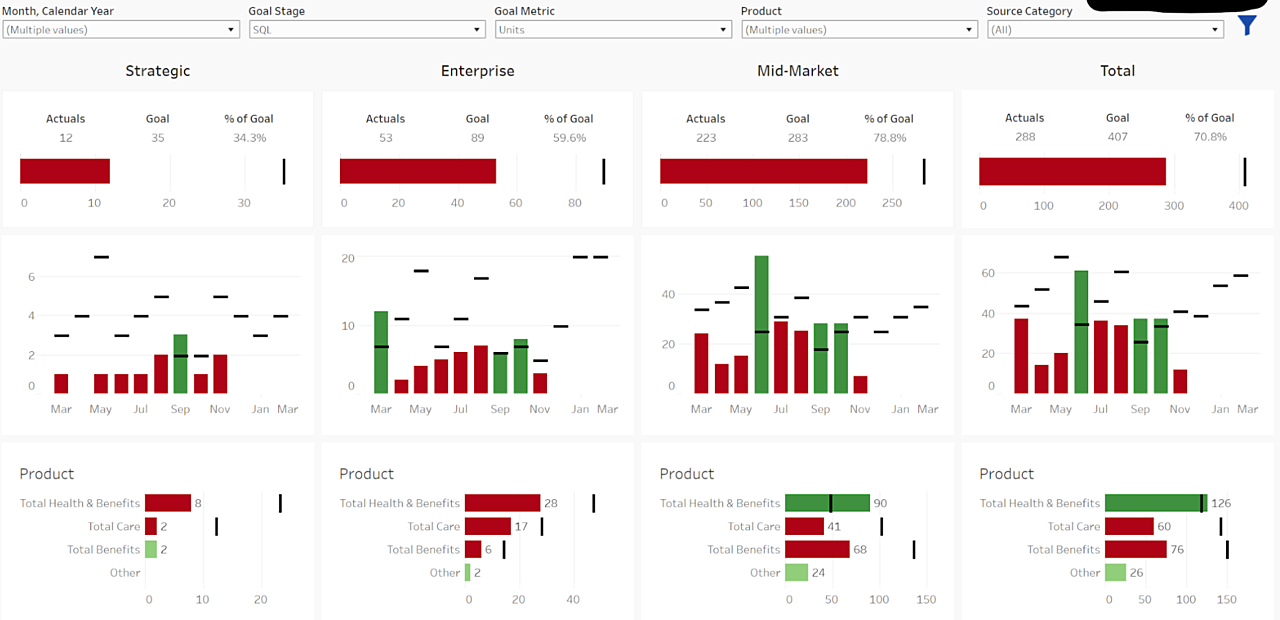
Our Data Visualization Consulting Success Stories
Goldline, Inc.
Learn how Three Ventures generated a +45% increase in call volumes on mobile devices from ad campaigns, a major direct response KPI of Goldli...
Kustomer
Learn how Three Ventures helped Kustomer drive a +301% increase in annual revenue from paid search, with a +237% increase in sales qualified ...
Trumpet Behavioral Health
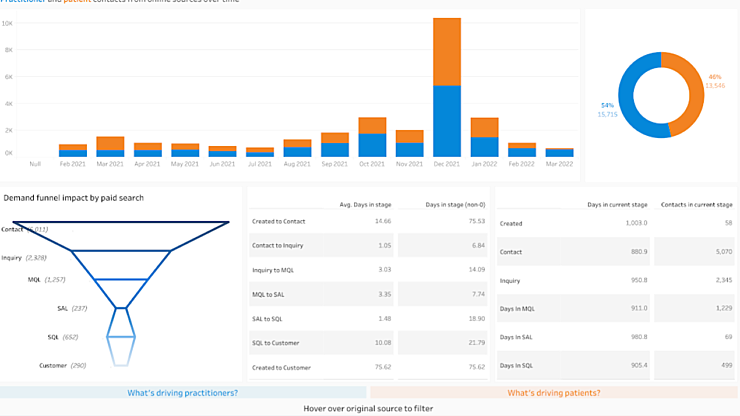
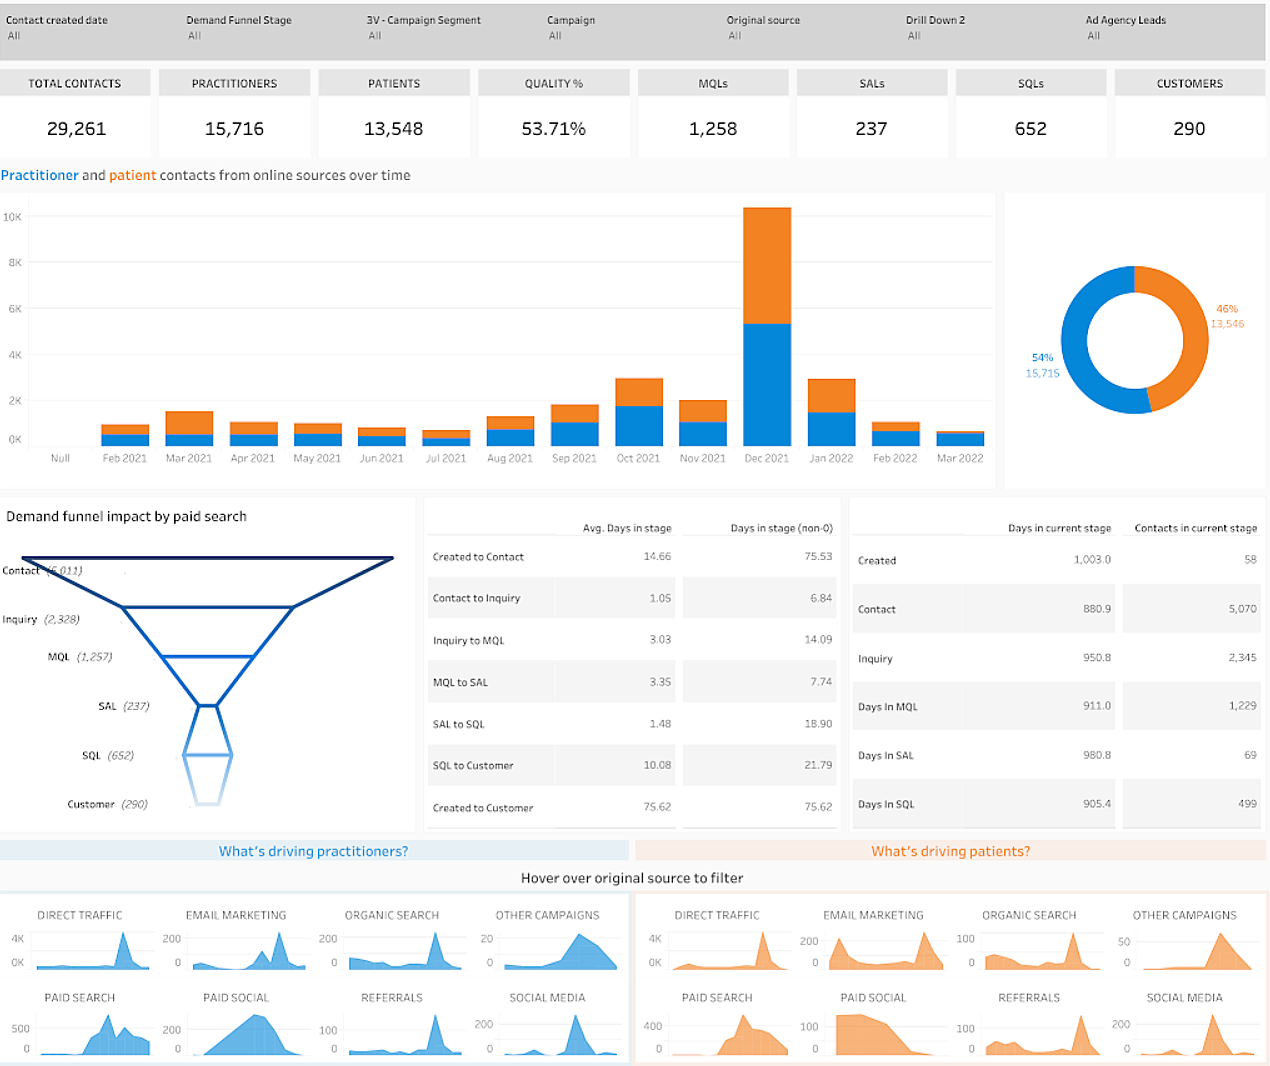
Learn how Trumpet Behavioral Health positioned themselves for greater understanding of their data and metrics with the consulting and impleme...
SFI Health Solutions
“3V asked thought-provoking questions that led our leadership to great insight about our business and what really drives it.”
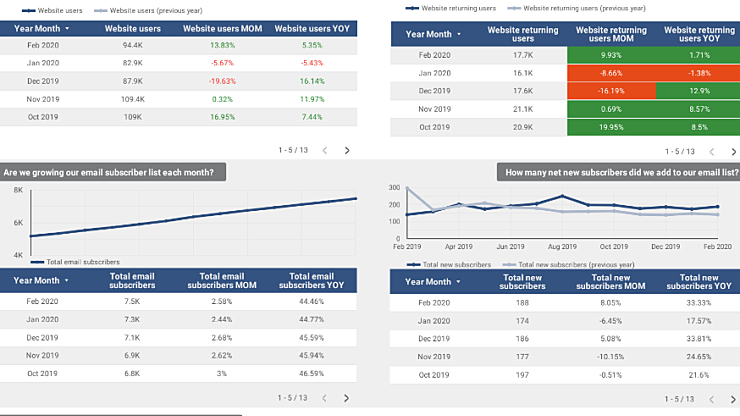
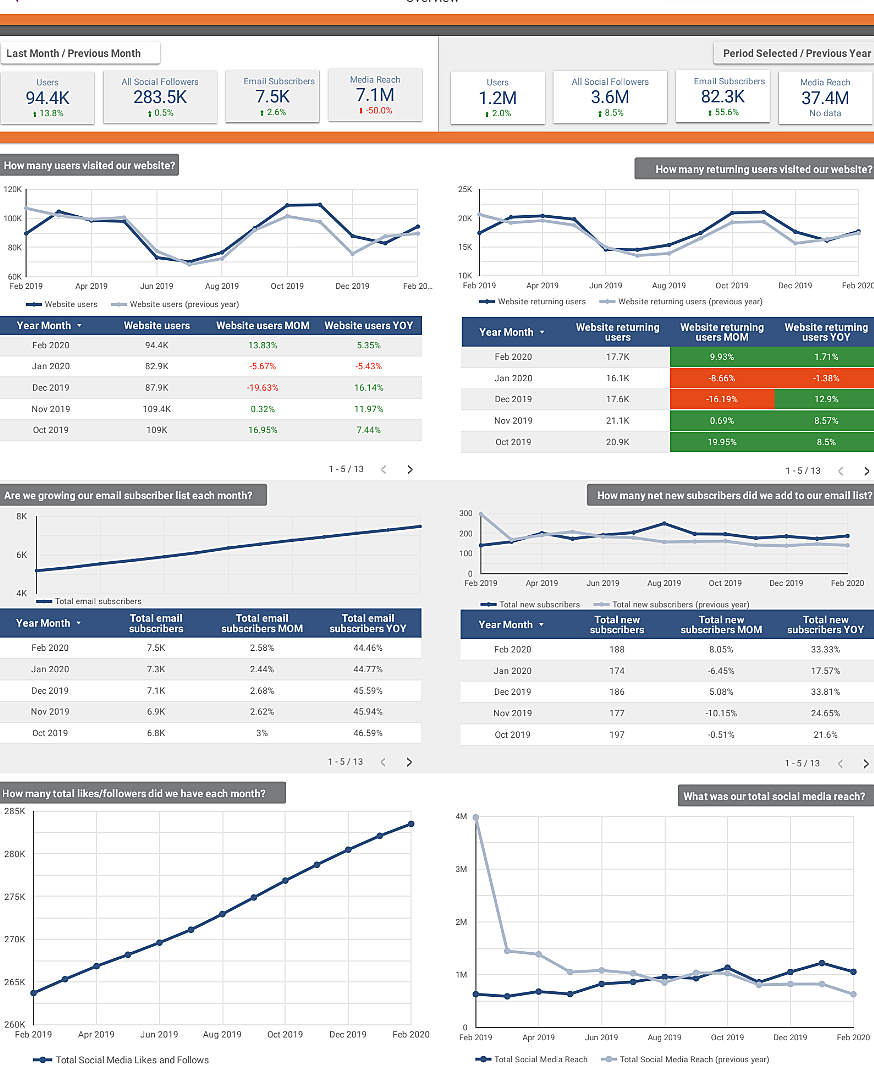
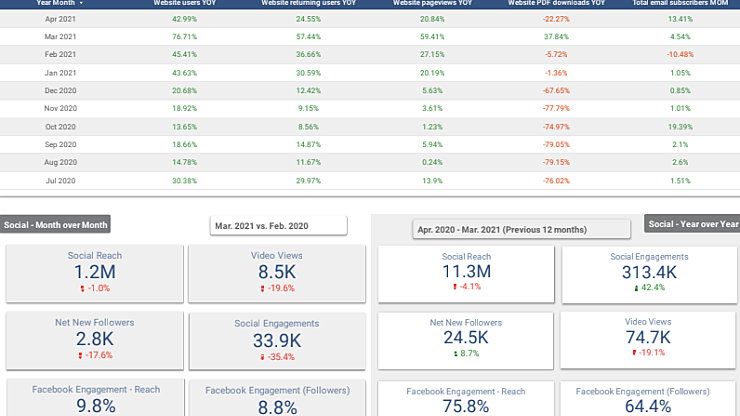
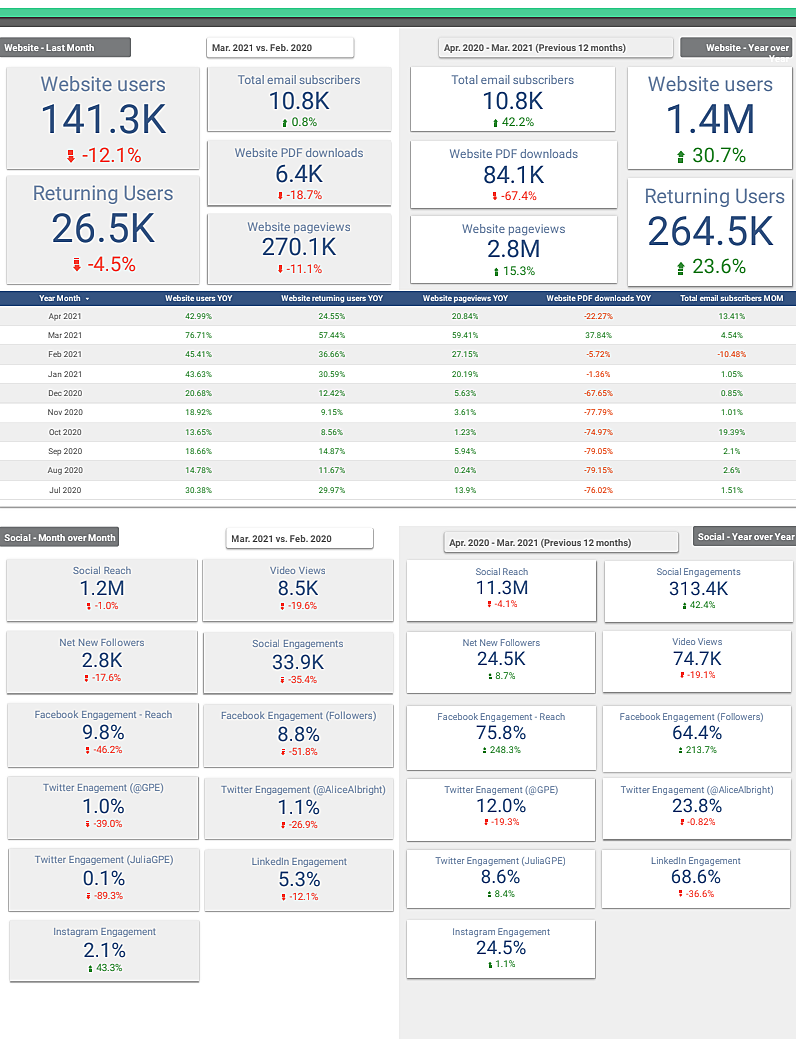
Global Partnership for Education
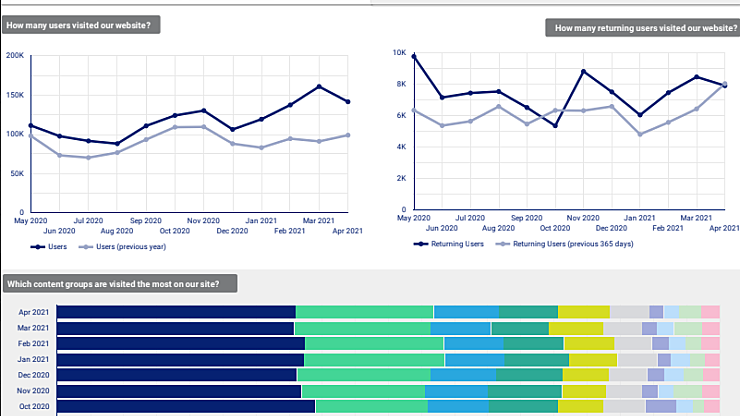
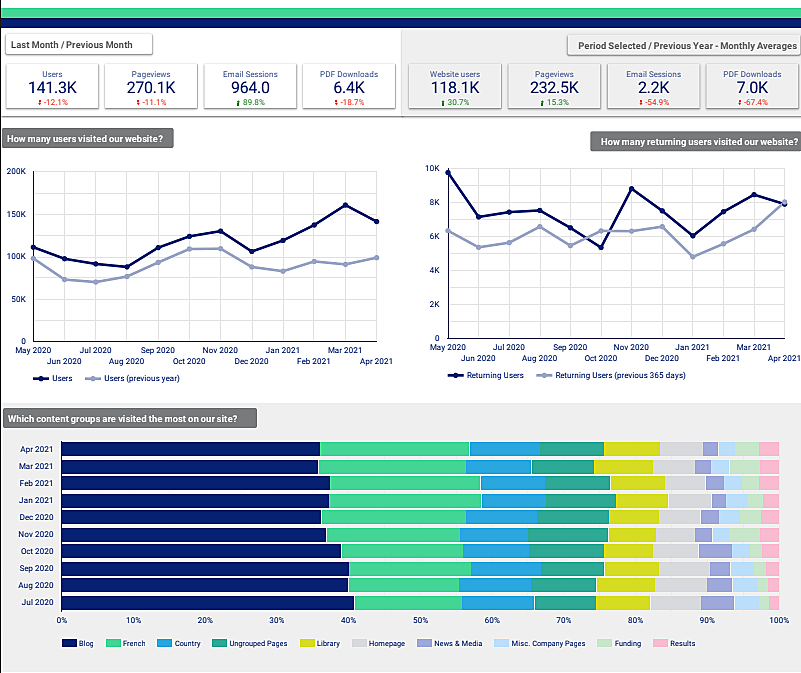
Learn how Three Ventures helped GPE increase annual donations on their site by +30%.
California Dental Association (CDA)
Learn how the California Dental Association (CDA) has regained confidence in their analytics data, after a strategic, targeted Three Ventures...


Get Help From Data Visualization Experts
Thank you for getting in touch!
We will get back to you as soon as possible
(usually within one work day).