

The best part is that these alerts can be delivered to any combination of emails. It REALLY does help marketing teams stay on top of the channels they manage. We use this exact same strategy at Three Ventures. As many of you may recall, this is the third and final post of our 'How To' with Google Analytics series at Three Ventures. These posts are meant to help you become a more effective digital marketer by leveraging the power of Google Analytics. Google Analytics is a great tool for marketers to use, but too often, they become overwhelmed with it’s complexity.
Our 'How To' series solves this. :) To help you battle the complexity of capturing channel specific key performance indicator data, we wrote How To Take Control of Your Marketing Channels With Google Analytics, which was featured on Kiss Metrics as one of the top ten resources for Google Analytics in 2014. To help you visualize the data that you capture with the above post, we wrote How To Visualize Marketing Channel Data With Google Analytics. I highly recommend that you read these posts as they offer simple, yet effective insight into what you really need to know about Google Analytics as a digital marketing professional. In summary, How To Take Control of Your Marketing Channels With Google Analytics focused on understanding how to use the Google URL builder correctly. How To Visualize Marketing Channel Data With Google Analytics focused on building custom dashboards to visualize the data captured with the Google URL Builder.
This way, instead of waiting for your boss or client to notice an increase or decrease in a KPI, any changes will be delivered right to your email inbox. At Three Ventures, we use these exact same tactics to help our partners and clients stay on top of their marketing channels.
Getting The Custom Dashboards You’ll Need To Set Up Custom Alerts
Custom dashboards are a great way to help marketers get channel specific data inside of one view in Google Analytics. You can build your own custom dashboards following our how to post, or you can cick one of the four links below to one-click import into your Google Analytics account. I recommend the later for those of you who are new to Google Analytics.
The Four Dashboard Types
Getting Ready To Plan Your Custom Alerts
In order to setup custom alerts that notify you about important changes in channel specific KPIs, you must first understand what the KPIs are for each channel. We do this at Three Ventures in a three step process, no pun intended :)
- Set a two month date range comparison for all channel specific custom dashboards, comparing the date range using 'previous year'. If you don’t have over a year of data, it’s okay to use the previous period setting.
- Print out every dashboard, label them, and tape each one to a wall, or do the equivalent digitally.
- Analyze the fluctuation of KPIs by channel for the YOY data and identify custom alerts from the analysis
Here's a picture of one of our conference rooms covered with custom dashboards.

... and my face, lol.
Identifying KPIs For Each Dashboard
For digital marketing professionals who aren’t analytics gurus yet, we recommend choosing one metric from each of the three types of KPIs below. Do this for every marketing channel that you want to set up custom alerts for.
- Acquisition: visits, new visits, % new visits
- Behavior: bounce rate, pages / visit, avr. visit duration
- Conversion: transactions, revenue, ecommerce conversion rate
As you continue advancing your digital analytics skills, KPIs will become more complex and vary based upon client or vertical. If you printed all the dashboards out, write each channels KPIs down on different sticky notes. Take the sticky note and place it to the side of each dashboard you have taped on the wall. This will help you remember channel specific KPIs when you begin to analyze the data.
How Custom Alerts Work In Google Analytics
Before you get into analyzing data in the dashboards, I’m going to ask that you take some time to understand how custom alerts work. This will help you get a better grasp around what triggers an alert. Custom alerts in Google Analytics work using three parts: period of time, a dimension filter, and a metric condition and comparison.
- Period of Time - tells Google Analytics how often it should check to see if conditions are met. There are three periods of time that can be selected: day, week, month.
- Dimension Filter - tells Google Analytics what dimension of your data it should use as a filter to analyze a metric.
- Metric Condition and Comparison - tells Google Analytics what metric, condition, and comparison is should use to see if conditions are met.
There are two outcomes of a custom alert: success and failure. If the alert conditions are met, the value is a true and Google Analytics will send you an alert. If the alert conditions are not met, the value is false, Google Analytics will not send you an alert.
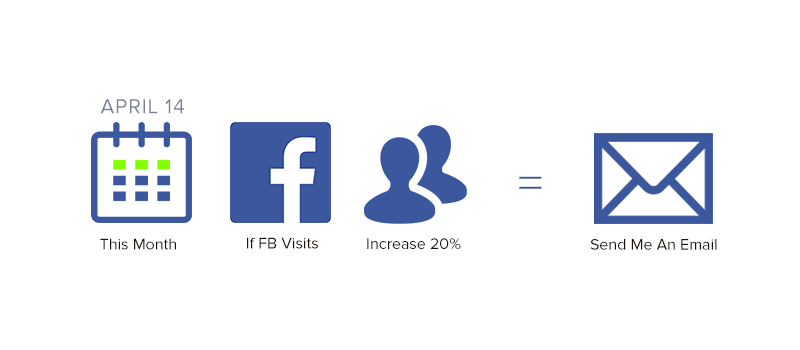
As you can see above, the alert is configured using the period of a week. It then filters all Facebook traffic using a dimension. When Facebook visits are greater that 700 for the given week, an alert is triggered and you’re sent an email. Note that this image does not show you metric comparison, which will be represented in the next image below.
Understanding Metric Conditions and Comparisons In Custom Alerts
The most important part of a custom alert is the metric condition and comparison. The metric condition of the alert tells Google Analytics what type of value is to trigger an alert. There are six types of conditions:
- Is Less Than
- Is Greater Than
- Decreases By More Than
- Increases By More Than
- % Decreased By More Than
- % Increases By More Than
Each condition requires a numeric value, either a whole number or a percent. These conditions are then subject to the metric comparison of a custom alert. The metric comparison of a custom alert is only available when the period is either day or month and the condition is not less than or greater than. Note that week is the only period that doesn’t have multiple comparison selections. There are five comparisons available, three for the period of day, and two for the period of month. The period of day comparisons are:
- Previous Day
- Same Day In Previous Week
- Same Day In Previous Year
The period of month comparisons are:
- Previous Month
- Same Month In Previous Year
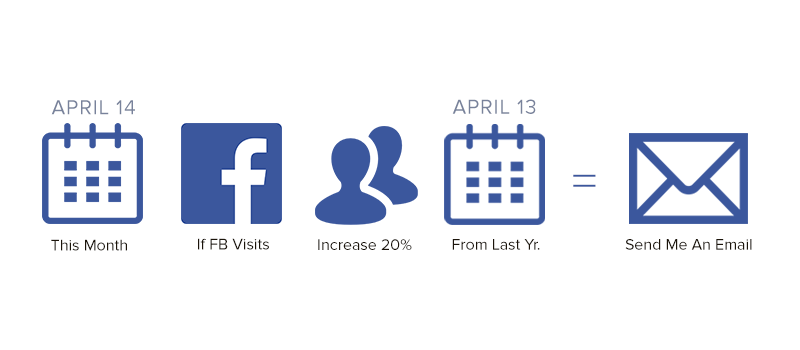
For example, a custom alert could be set up using the period of month, filtering all Facebook traffic, and alerting when visits increases by more than 20% compared to the same month in the previous year. The condition for the above example is “% increased by more than” and the comparison is “same month previous year”. Reference the image below of the example.
Identifying Conditions of KPIs That Will Trigger Custom Alerts
When analyzing the KPIs of each channel make sure that you identify both increases and decreases. The reason that you want to look for both is that an alert can only send for one condition. For example, if you wanted an alert to be sent when Facebook visits decreased 10% from the day prior, you would only be sending an alert about a decrease in visits. So what about an increase? You would have to configure another alert if you wanted to be notified about an increase. It’s important to identify the conditions of channel specific KPIs, both decreases and increases, that will be used to trigger an alert. Let’s use an example from a hypothetical client, Mr. X. After reviewing the email marketing custom dashboard from above, we identify that it’s very uncommon for Mr. X’s acquisition KPI of visits to increase or decrease more than 10% in a given week. We also identify that Mr. X’s email visits typically have a bounce rate of 28%-32% in a given week. Bounce rate is the behavior KPI that Mr.X uses to judge email message relevance according to lists and segments that he sends to. Historically, Mr. X’s email conversion rates have been 7%-10% for any given week.
Implementing Custom Alerts To Proactively Monitor Marketing Channels
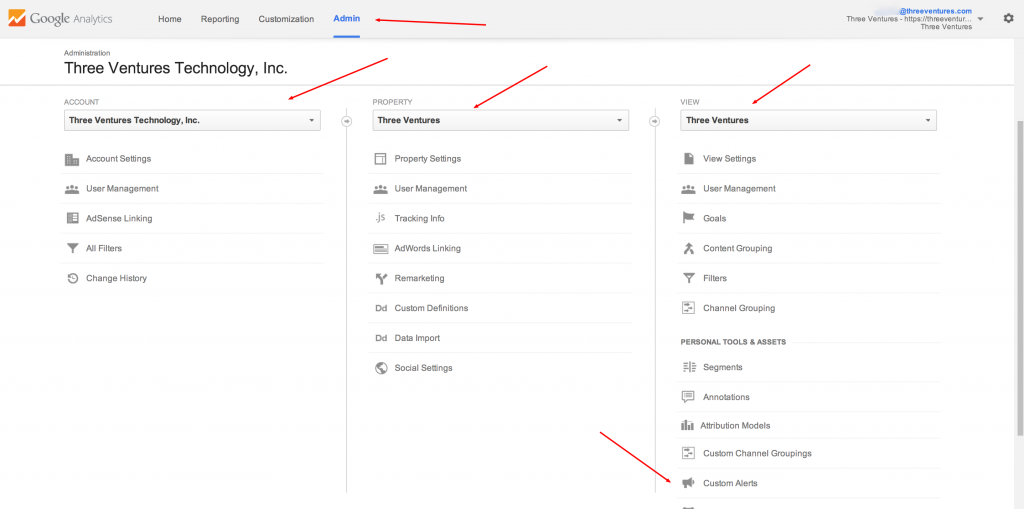
Pretend that after you analyze your data in the email marketing dashboard from above, that you reach the same conclusions as Mr. X. To proactively monitor your email marketing, you’ll need to set up six alerts. The alerts will be for an increase and decrease in acquisition, behavior, and conversion related KPIs. To implement custom alerts into Google Analytics, first log into your account, then click the admin tab in the top-level navigation. Once you’ve done this, select the account, property, and view that you want to set up the alert in. Under the view column of the admin tab, select ‘Custom Alerts’. Reference the image below for aid.
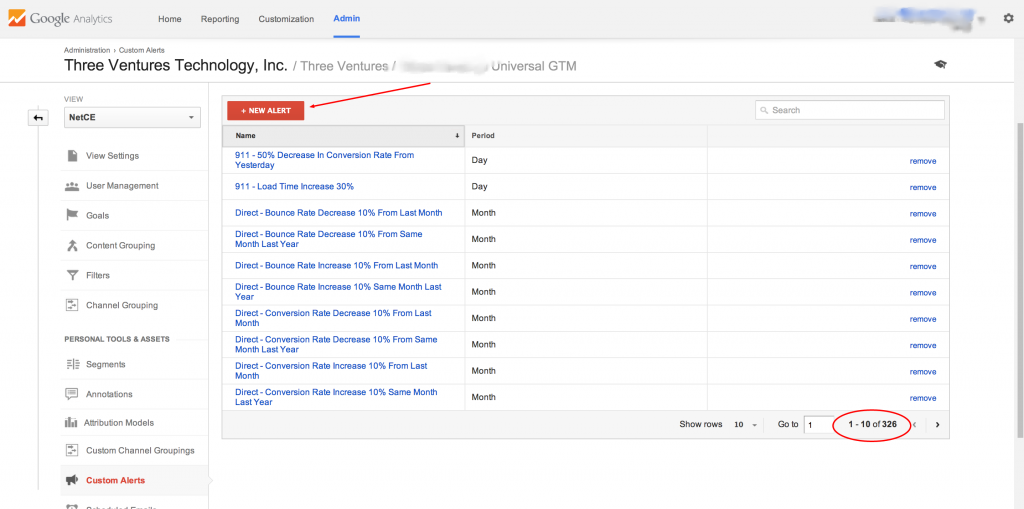
After you click on the custom alerts link under the view column, you should come to a screen that has a table of all alerts for the property that you’re viewing. Click the big red button in the upper left hand corner that says “+New Alert”.
Follow the steps below to create alerts for your acquisition KPI of visits, both 10% increase and decrease.
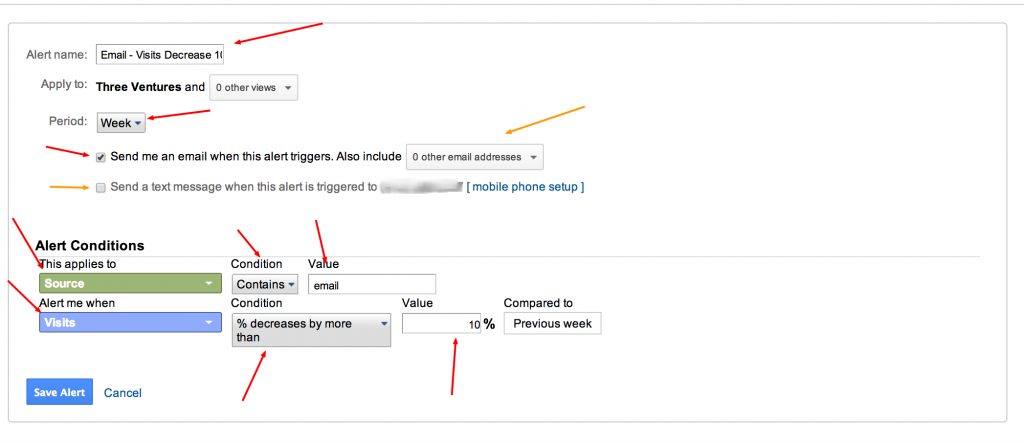
- Name The Alert - Email - 10% Decrease In Visits From Last Week. This name let’s you know exactly what the alert is about when you get an email.
- Configure The Period - Choose week.
- Click The ‘Send Me An Email’ Checkbox - You can choose to send an email alert to other users on the account or get SMS messages if you have a mobile phone number configured on the account.
- This Applies To (Filters The Data) - Choose ‘Medium’ in the dimensions box (Green box). Set the condition to ‘Contains’. Set the value to ‘Email’.
- Alert Me When - Choose ‘Visits’ in the metrics box (Blue Box). Set the condition to ‘% decreases by more than’. Set the value to ’10’.
- Click Save
Reference the image below to see the exact configurations.
To set up the alert for a 10% increase in traffic, you would use the exact same configurations, except with the metric (Blue box) condition of ‘% increases more than’, and the name of ‘Email - 10% Increase In Visits From Last Week’. To build alerts for the behavior KPI of bounce rate being more than 32%, or less than 28%, follow the instructions below.
- Name The Alert - Email - Bounce Rate Less Than 28%
- Configure The Period - Choose week.
- Click The ‘Send Me An Email’ Checkbox- You can choose to send an email alert to other users on the account or get SMS messages if you have a mobile phone number configured on the account.
- This Applies To (Filters The Data) - Choose ‘Medium’ in the dimensions box (Green box). Set the condition to ‘Contains’. Set the value to ‘Email’.
- Alert Me When - Choose ‘Bounce Rate’ in the metrics box (Blue Box). Set the condition to ‘Is less than’. Set the value to ’28’.
- Click Save
To set up the alert for bounce rate being more than 32% for any given week, use the same configurations from above. This time change the metric (Blue box) condition to ‘Is greater than’ with a value of ’32’. Don’t forget to change the name to ‘Email - Bounce Rate More Than 32%’. Reference the image below to see the exact configurations.

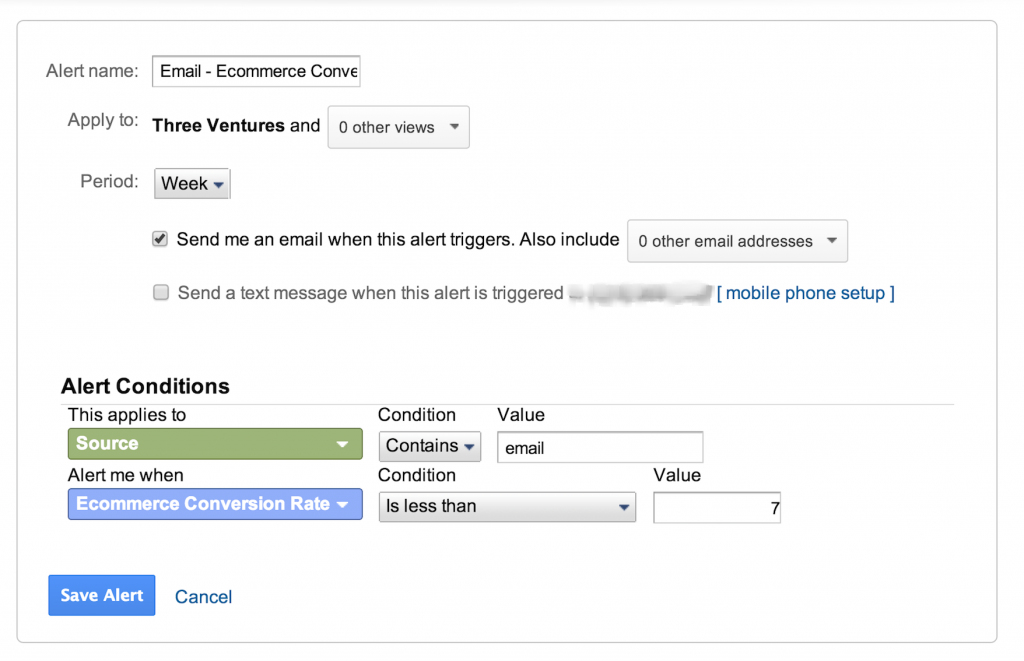
To build alerts for the conversion KPI of Ecommerce conversion rate being more than 10%, or less than 7%, follow the instructions below.
- Name The Alert - Email - Ecommerce Conversion Rate Less Than 7%
- Configure The Period - Choose week.
- Click The ‘Send Me An Email’ Checkbox - You can choose to send an email alert to other users on the account or get SMS messages if you have a mobile phone number configured on the account.
- This Applies To (Filters The Data) - Choose ‘Medium’ in the dimensions box (Green box). Set the condition to ‘Contains’. Set the value to ‘Email’.
- Alert Me When - Choose ‘Ecommerce Conversion Rate’ in the metrics box (Blue Box). Set the condition to ‘Is less than’. Set the value to ’7’.
- Click Save
To set up the alert for Ecommerce Conversion Rate being more than 10% for any given week, use the same configurations from above. This time change the metric (Blue box) condition to ‘Is greater than’, using a value of ’10’. Don’t forget to change the name to ‘Email - Ecommerce Conversion Rate More Than 10%’. Reference the image below to see the exact configurations.
Great! You've just implemented six alerts to help your proactively stay on top of your email marketing. Now lets take a look at how these alerts will help you stay on top of optimizing channel specific KPIs.
How To Take Advantage Of Your Hard Work Building Custom Alerts
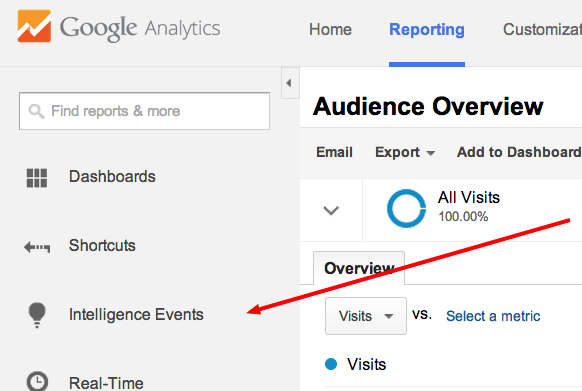
This portion breaks down what you should do once an alert goes off and you're sent an email. Start by reviewing the alert names in the email. Then log into Google Analytics. Click the ‘Intelligence Events’ tab on the left-hand menu to view a segmented break down of alerts
For example, you can view breakdowns daily, weekly, or monthly events that are triggered. Let’s take a look at an example reviewing a monthly event that triggered for a client of ours.
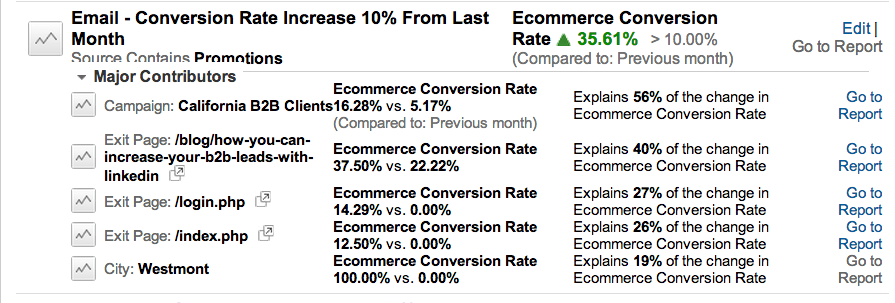
This monthly alert triggered to let us know that email conversion rate for the last month increased over 10%! For this specific type of email, a promotions email, the conversion rate increased 35.61% from the month previous. But what caused this campaign to be so successful with increasing the conversion rate? It looks like the campaign “California B2B Clients” had a 56% increase in conversion rate from the last month. With this being said, we did launch a responsive email template for this client. Looks like it did pretty well, so we’ll want to highlight this as well as mobile email performance in our weekly communication with the client. So what about all these exit pages? How does an exit page lead to an increase in conversion rate? Visitors from the email can click through a link and land on a specific page. In this example, the LinkedIn blog post, the home page, and the login page are our exit pages. When a visitor landed on one of these pages from the email and left, Google Analytics records an exit. For these landing pages, we did suggest changes for the client to help minimize exits. Even though some visitors still exited from these pages, the ones that didn’t, converted at a higher conversion rate than the month prior. After conformation, the client did implement the changes prior to the emails being sent. After checking to see if there were any other changes on the pages, it was identified that the only changes made were the recommendations given to the client. With this being said, we highlighted this in our weekly communication with the client.
The Power Of Custom Alerts In Google Analytics
As you can see, custom alerts are very powerful when implemented for multiple marketing channels. The custom alerts will help you stay on top of management, identify KPI trends by channel, and help you make data-driven decisions when communicating with your boss or clients. At Three Ventures we use custom alerts for almost every client to help us stay a step ahead in ever-changing markets. We recommend that you use them too!
Wrapping Up This Series Of ‘How To’ With Google Analytics
We’ve had a great time at Three Ventures writing these posts for the digital marketing and analytics communities. We hope that this series of ‘How To’ with Google Analytics has provided you with an in-depth understanding about how you can leverage GA’s tools to become a data-driven marketing professional.
In Summary
- How To Take Control of Your Marketing Channels With Google Analytics - How to use the Google URL builder to track channel specific data. Focuses on data capture and segmentation.
- How To Visualize Marketing Channel Data With Google Analytics - How to build custom dashboards in Google Analytics. Focuses on visualization of channel specific data captured with the Google URL Builder.
- How To Proactively Monitor Your Marketing Channels With Google Analytics - How to set up custom alerts in Google Analytics. Focuses on proactively staying on top of the marketing channel management.
Feel free to share across your social networks or signup for our email newsletter to get more Google Analytics tips and tricks. If your looking for a reputable vendor like Three Ventures to help implement any of the strategies above, feel free to contact our Google Analytics Consultants. Need help optimizing your website or marketing machine? Get in touch with us.


