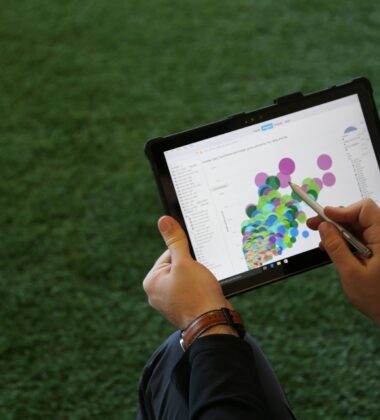
Three Ventures engaged SFI Health in a series of strategic workshops with key stakeholders and operations teams. Through a proprietary business intelligence discovery process, we gained operational clarity and uncovered the insights required for a refined business intelligence approach. Through discussion, discernment and focus, we explored data solutions, uncovered data shortcomings and refined the project scope and deliverables to support these requirements.
Once we established the clients needs, clarified operational timelines and refined the focus, we gathered and vetted data sources and confirmed validity of available data and intelligence against established objectives. Keeping the scope refined, we were able to build actionable intelligence dashboards and share these with key stakeholders for review and refinement in real time, augmenting and supplementing as necessary through engagement across the organization. Once visualizations and data met performance thresholds and criteria, we established roles-based functions and access points with Tableau Server in preparation for global corporate adoption and awareness training.
From start to finish, Three Ventures has engendered a culture of data oriented business intelligence and insights. A number of SFI Health departments operated, historically, from incomplete sales data or anecdotal product insights. With the help of Three Ventures, SFI Health has become an increasingly data-oriented and intelligence-driven organization with new perspectives on data, more tracking insights and an increased potential for scaled operations and sales based on continually cultivated, tracked and vetted data sources centralized for ready access by global sales, marketing and operations teams.

Identify, Define, and Visualize
- 1Assess sales trends including forecasts
- 2Identify high-value customer segments based on past sales data
- 3Coordinate product SKUs and sales data for new insights
- 4Visualize sales performance by distribution channels, sales regions and product groupings
- 5Train stakeholders and teams to employ data-driven insights
- 6Foster a culture of collaborative, data-driven decision making for sales, marketing and finance
Collaborate, Engage, and Integrate
- 1Engaged business leaders in collaborative workshops
- 2Identified opportunities to assess and address key questions
- 3Integrated existing data and definitions
- 4Validated data sources
- 5Developed dashboards and visualizations to answer questions identified in collaborative workshops
- 6Reviewed dashboards and visualizations with business leaders and changed details in hands-on data sessions
- 7Trained internal stakeholders and established internal roles-based access
Centralized, Visualized, Actualized Business Intelligence
- 1Centralized key reports and data access with Tableau Server
- 2Engaged an evolving stakeholder team in the evolution and ongoing maintenance of data sources
- 3Increased productivity and insights across departments
- 4Fostered a culture of data and metrics-based decision making
- 5Accelerated sales cycles and improved outcomes
- 6Created lasting utility and scalability for data-informed growth and business acceleration


