

In this post, we'll focus on the importance of dimension drilldowns in Google Analytics custom reports. We structured these dimensions around a hierarchy that both our design and analytics teams have found to be the most effective in pinpointing responsive design bugs.
Download The Custom Reports Before Reading
Note that there are two types of custom reports for monitoring responsive web design. One is for sites that use goal conversion tracking. the other is for sites that use ecommerce for conversion tracking.
You can also share these custom reports on Twitter by Tweeting this using the Twitter icons in the header or footer.
How To Monitor Responsive Web Design With Google Analytics - The Reporting Issues
We don't have to tell you that Google Analytics is complex. It's because of such complexity that using the platform to track and measure responsive design changes can be quite a task. You could go into the technology and mobile reports to get a high level overview of what's going on. From this, you could measure an 'impact' on the device category, but what about needing to know KPIs for OS versions and / or browsers for specific device categories? When making well-informed decisions, it's good practice to look for lower levels of data following a segmented hierarchy. The inability to find low level data using out of the box Google Analytics reports is a common issue. Most often, you have to apply advanced segments and filters to get to this data, but what if you don't know how to do this?
Setting Up The Custom Report
We collaborated with our design and engineering team to create a Google Analytics custom report. Here's how they worked with us to help solve the issue at hand. Our designers and engineers need specifics. That's when we sat down with @CurtisMorte, our lead engineer in house; Also the guy who increased our Goal Conversion Rate 372.91%. He helped us lay out the hierarchy we needed to identify low level data.
Three Ventures Hierarchy For Identifying Responsive Web Design Bugs
Curtis pointed out that most bugs we have found with responsive web design have always been identified with a specific top down hierarchy.
- Device Category
- Operating System
- Operating System Version
- Browser
- Browser Version
When reporting bugs, our teams start at number one and move down to number five until specifics are located for each section. So how do we put this to use in Google Analytics?
Using Google Analytics Custom Reports To Monitor Responsive Web Design
Custom reports in Google Analytics allow users to create reports for any compatible set dimensions and metrics. Remember the numbered list defined above? Yup, all of those are dimensions in Google Analytics out of the box! Custom reports in Google Analytics also include dimension drilldowns. Remember the issue of not being able to see sequential data in one report? You guessed it, dimension drilldowns make this possible. To pick what data we wanted to show for all of the dimensions, we analyzed common client KPIs for both lead generation and ecommerce models. Here's our list of common KPIs:
- Users
- Sessions
- Bounce Rate
- Conversion Rate (Ecommerce & Goal)
- Revenue
- Goal Completions
Now let's take a look at the custom report you've imported into your Google Analytics account. If you haven't done that, please go import the reports now.
Three Ventures Custom Reports For Monitoring Responsive Web Design.
We ended up building two custom reports due to the common KPIs from above. One for ecommerce sites and one for lead generation sites. The difference between the two is the type of KPI reported for conversions. The ecommerce custom report uses ecommerce conversion rate and revenue for conversion metrics. The lead generation report uses goal completions and goal conversion rate for conversion metrics. Let's take a look into the reports. Again, please go download the custom reports if you haven't already. Having the report open and going through your data like we do below is key to understanding how the report is to be used. Log into Google Analytics, click on 'Customization' in the top level navigation. Then, click on the report you downloaded from our email. If you would like to change the KPIs for the report, click edit in the sub-navigation and edit the blue boxes, or metrics, to report on the KPI desired. Click on the reports, you should see one like this:
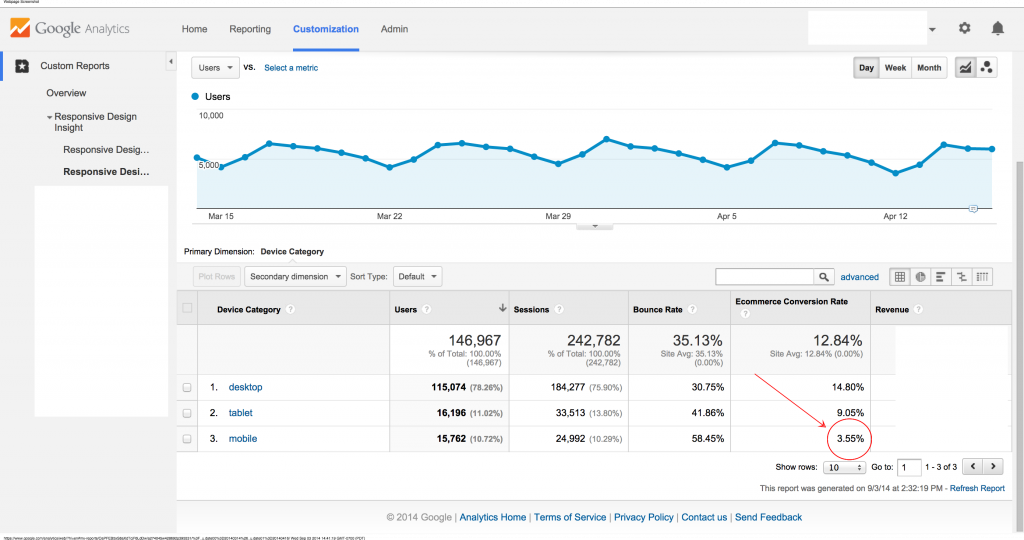
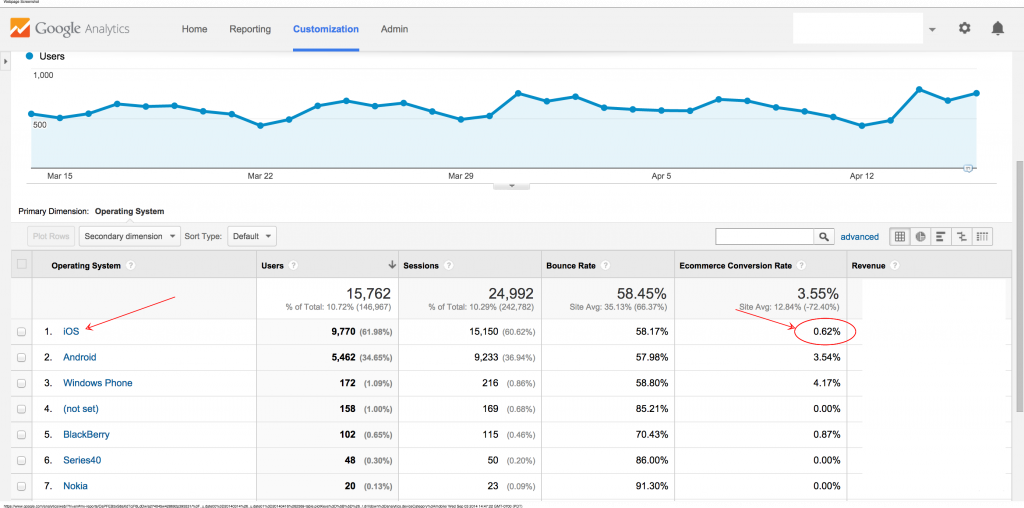
Lets walk through the step by step process of analysis. To begin, start at device category and look at the data above. Notice mobile has a significantly lower conversion rate? Next, we'll click on mobile and move to the operating system. Look at the data below. iOS seems to have a low conversion rate. Next, we'll click on iOS to see the OS version.
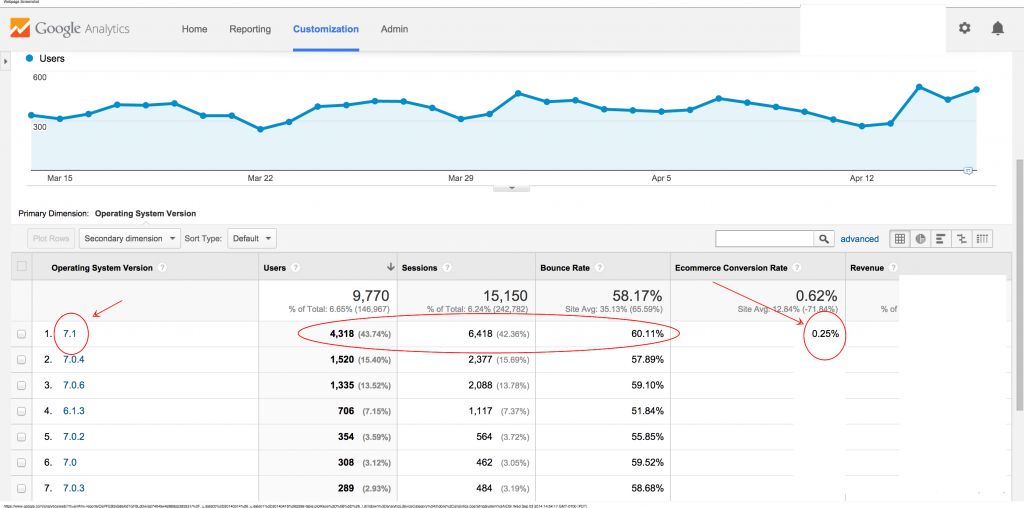
Now we can see all versions of iOS on mobile devices. Look at the data below. Version 7.1 is has a lower than average conversion rate (All other have been removed to show the average conversion rate in the column heading and 7.1 only). Next, we'll click on 7.1 to see the browser.
Now we can see all browsers used on that version 7.1 of iOS on mobile devices. Look at the data below. Safari doesn't have any conversions! This means that we have an issue with Safari. Stop here and report the findings!
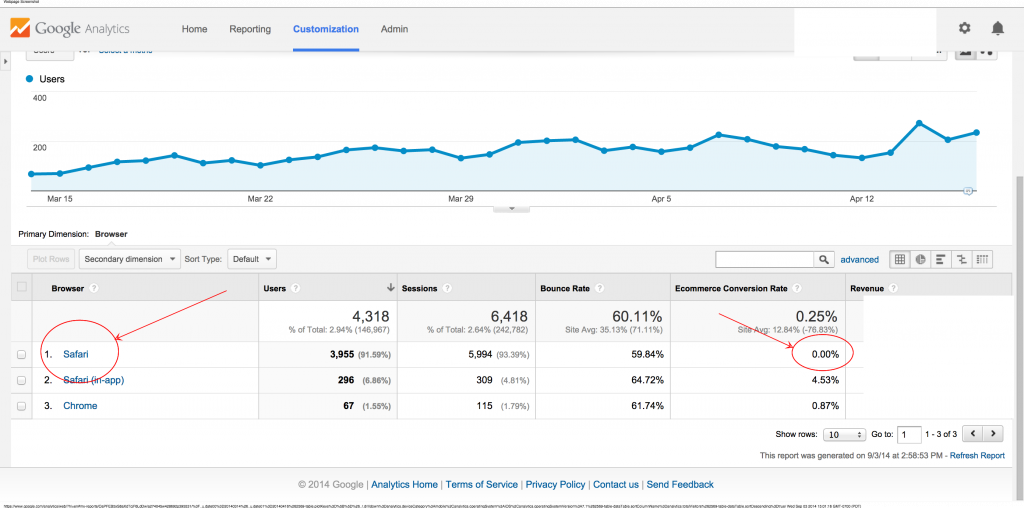
For example, you would create a bug report saying "We have a 0% conversion rate on iPhones using iOS version 7.1 with Safari. Can you please take a look?". At this point your engineering and design teams can use actual devices to test the issues or use tools like BrowserStack to recreate specific environments. But what if Safari had a .12% conversion rate, couldn't you click on safari and go to the browser version? Yes! However, in this example, because there was a flatline in conversion rate when we got to mobile / iOS / 7.1 / Safari, we couldn't go to a lower level of data as there wasn't any. If there was, you could create a bug report that includes it. For example, we would let our engineering team know "We have a .12% conversion rate on iPhones using iOS version 7.1 using Safari 7.0. Can you please take a look?". This is just one of many possible findings that can be easily found with our responsive design custom reports.
Let Us Know What You Think!
We hope that you enjoyed this post as much as we did working on it for you. Remember that we built our custom report dimension structure based upon our engineering team's best practices for finding RWD bugs. We use these reports almost every day with our clients and hope that you'll find them as an added value in Google Analytics. Feel free to share this post with your design and analytics teams to get their input and make any necessary changes. Tweet @ThreeVentures with your Google Analytics questions or thoughts. Need help optimizing your website or marketing machine? Get in touch with us.


