

Let's face it, ROI is a term that most marketers sell on, but fail to report on data that proves it. We're aware that a majority of marketers aren't software engineers or developers, and that integrating 3rd party conversion codes on thank you or checkout pages for social advertising platforms can be quite the task. That's why we decided to write "How To Measure Social ROI With Google Analytics" (And why Alan spoke on it). So why don't more people use Google Analytics to measure social ROI?
Well, marketers know that they can link Adwords and Analytics to show ROI for Adwords. They just don't know that they can show ROI for other channels too, specifically social media. Let alone how easy the process is (Easy assuming you can read this post :) ). Watch the video below for a summary before you get started.
After Reading "How To Measure Social ROI With Google Analytics" You Should Be Able To...
- Understand why tagging your links is important.
- Understand how to upload cost data to Google Analytics.
- Use a custom report to automate reporting of social media ROI and growth hack social channels.
All without IT help or programming required. Lets get started.
For those of you who already know how to do this and are looking for the custom report needed to measure and report on Social Media ROI, go Download the report
For those of you who would like to see the presentation from Search Marketing Expo, it's below.
How To Measure Social ROI With Google Analyticsfrom Alan Morte
Tagging Your Social Updates and Ads
Before you can measure ROI, you need to make sure that Google Analytics is properly recording your social traffic. What does properly recording mean? It means that Google Analytics knows exactly where the traffic came from, what they clicked on to get to your site, and the name of the marketing campaign responsible. Let's take a look at why you need to do this. If you were to go to your 'All Traffic' report, you'll probably notice that you have multiple variations of traffic sources that come from the same domain. An example of this is Facebook. If your posts and ads don't include any tags, your data probably looks something like this.
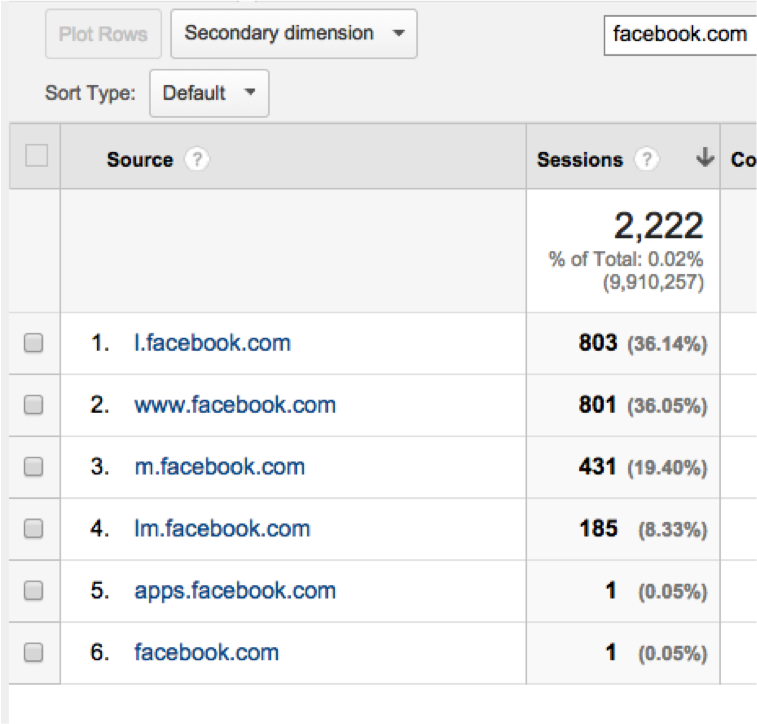
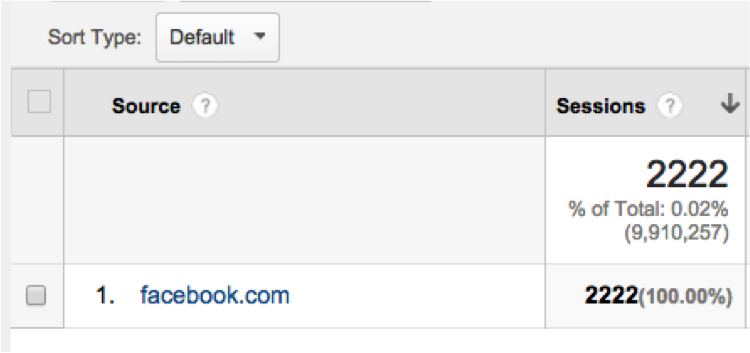
So how do you tell Google Analytics that all this traffic should be grouped as coming from Facebook.com? With UTM parameters (Url Tags). UTM parameters are values that are added to the end of a link that tell Google Analytics more information about traffic from a specific link. For example, if tags were added to the links that sent the Facebook traffic from above to your website, your data would look then look like this.
To do this, you unfortunately have to manually add these tags to URLs associated with paid and owned social media traffic. Worried about how much time that takes? Here's a cleaver hack on implementing tagging into your workflow to save time. What if you don't know anything about tagging, how it works, and how to use it? We have a how to blog post for you to read on it. It was featured as one of the top ten resources for Google Analytics in 2014.
What's The Deal, Why Is Tagging So Important? I Came Here To Measure Social Media ROI!
Being able to measure Social ROI relies solely on your ability to tag links properly. Let me explain. How is Google Analytics supposed to associate the cost of your social media efforts to measure any ROI if it doesn't know what traffic the cost is to be applied to? Ahhh... this is suddenly making sense! :) But wait... How does Google Analytics know the cost of my social media efforts? Or what campaigns and ads incurred the cost? That's where the data import feature comes in.
Understanding The Data Import Feature In Google Analytics
The Data Import tool is a glorified file uploader. In short, you can upload data that can be added into your Google Analytics account for specific views. This is done inside of the Google Analytics interface, no API usage or 3rd party plugins required. The data import feature allows you to upload multiple types of data, however for this post, we're going to focus on cost data. Cost data associates costs for campaigns, and their ads, that send traffic to a website. By uploading cost data, Google Analytics will now have the ability to calculate metrics like ROI and ROAS. Yes, it's as simple as tagging your links, formatting a CSV file, and uploading it. Now let's talk about the specifics you'll need to know.
How Uploading Cost Data Works In Google Analytics
When you upload a file with the Data Import tool, Google Analytics looks for preexisting data to associate the uploaded cost data with. How does it know what preexisting data to look for? In the file that you upload, you will have to tell Google Analytics what preexisting data you want to associate the uploaded cost data with. For example, if you were uploading the costs of running a Facebook Ad, you would tell Google Analytics to associate the cost with the traffic that came from your Facebook Ad. Remember how I told you tagging your links is super important? In order for Google Analytics to associate the cost data from your Facebook ads to the traffic driven from it, it will need to match up the traffic using the values from your tagged links. See how all of this is coming together? The process looks like:
- Tag Your Links With UTM Parameters.
- Use The Tag Values To Associate Preexisting Data With Uploaded Cost Data.
- Use Cost and Traffic From Tag Values to Measure ROI.
Awesome, now you understand how tagging and cost data uploads work together. You've tagged all of your links and want to get started on uploading cost data. Let's Go!
Setting Up A Data Set - Step One
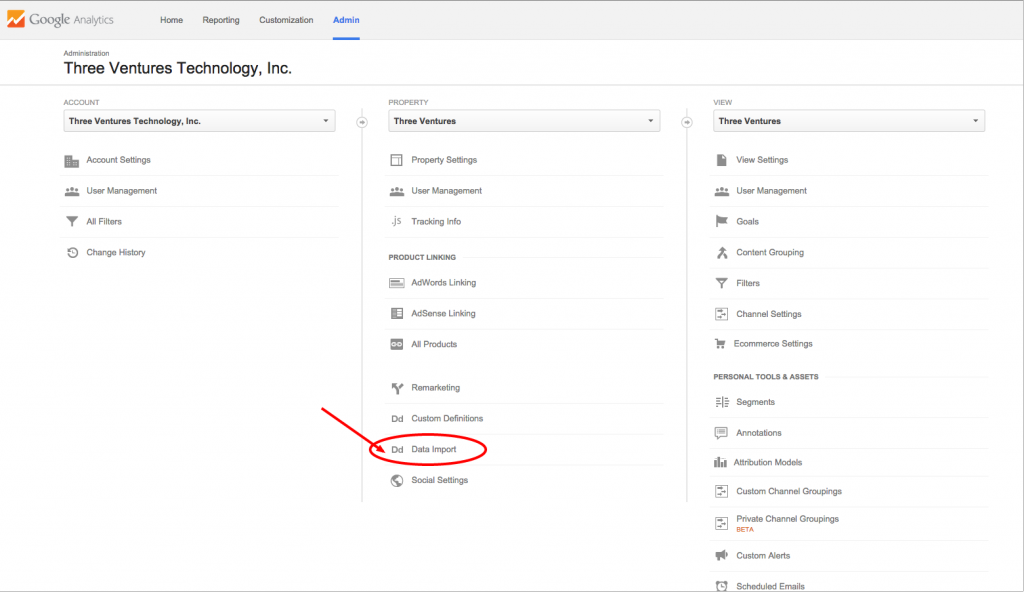
Login to your Google Analytics account and click the admin tab for the account you want to upload cost data to. Under your property settings, click data import.
See that big red button, click on it.
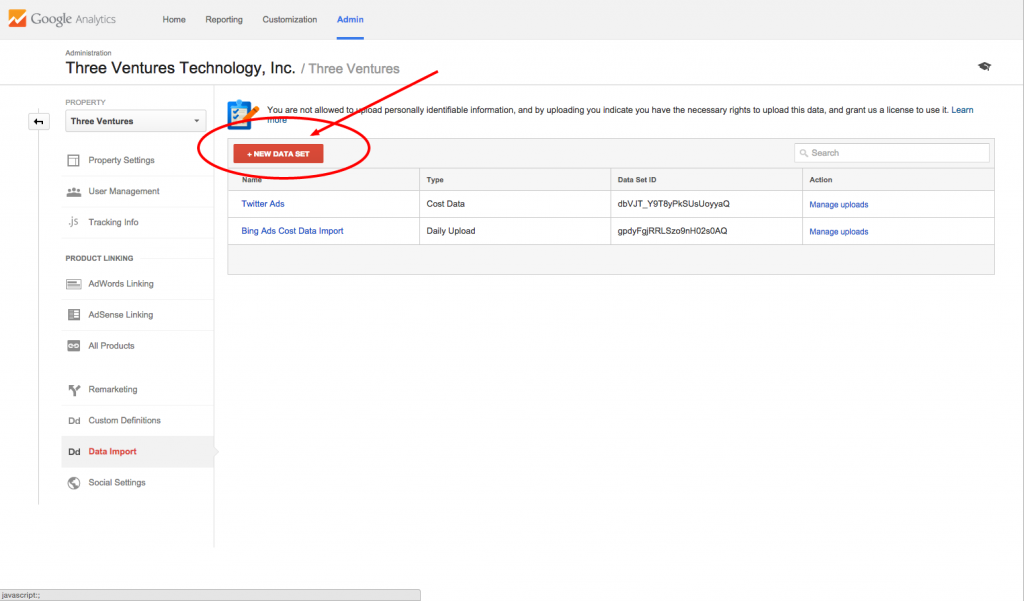
After you click '+New Data Set', you should see a page like below come up.
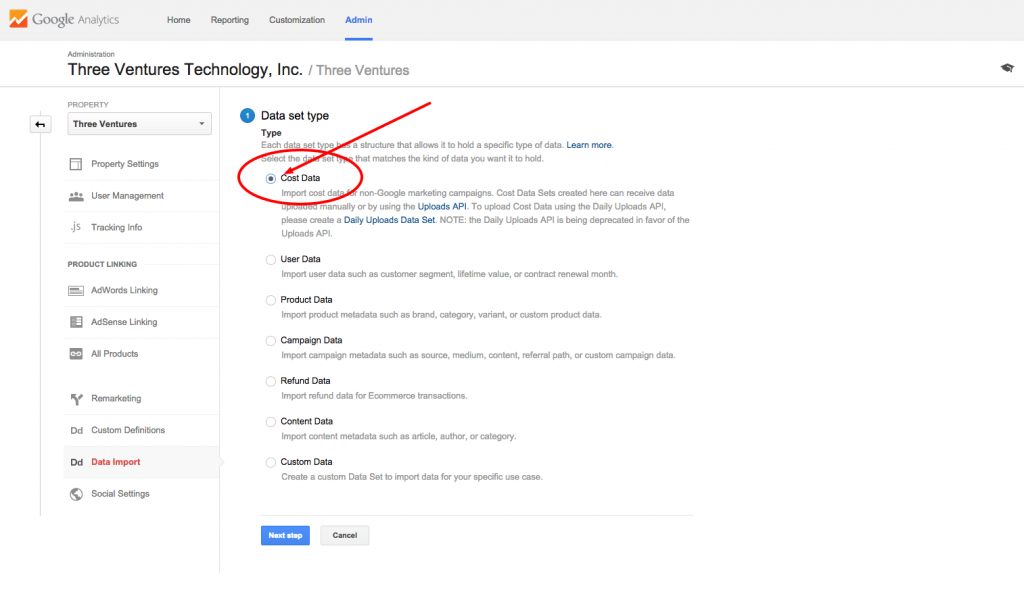
Select 'Cost Data' for the type and click next, you should see a page like below come up.
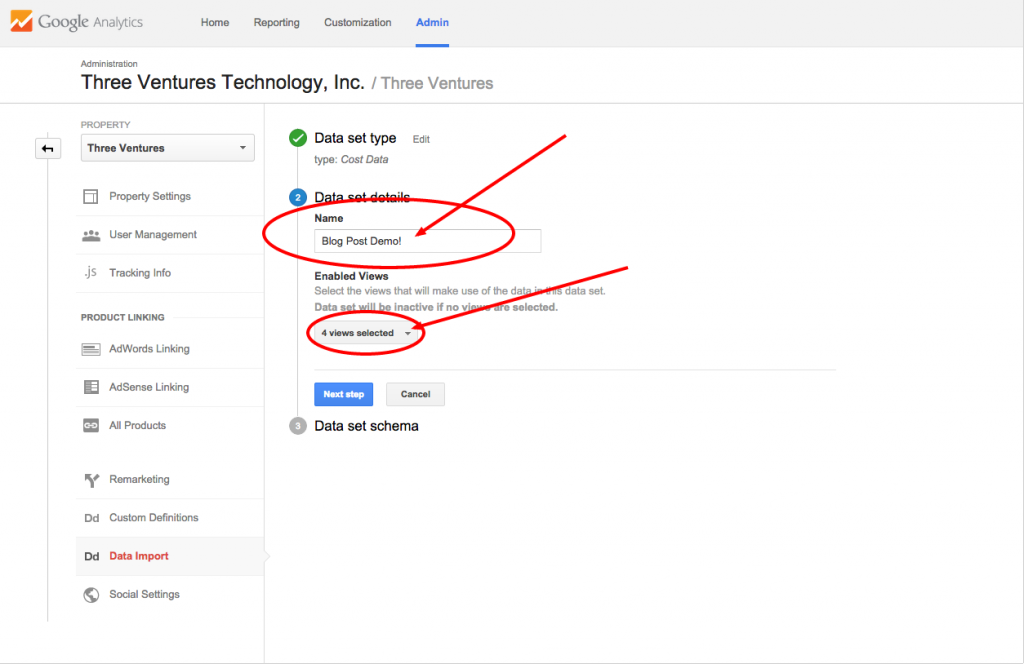
Name your data set using to name of the social property you want to upload cost data for and click next. You should see a page like below come up.
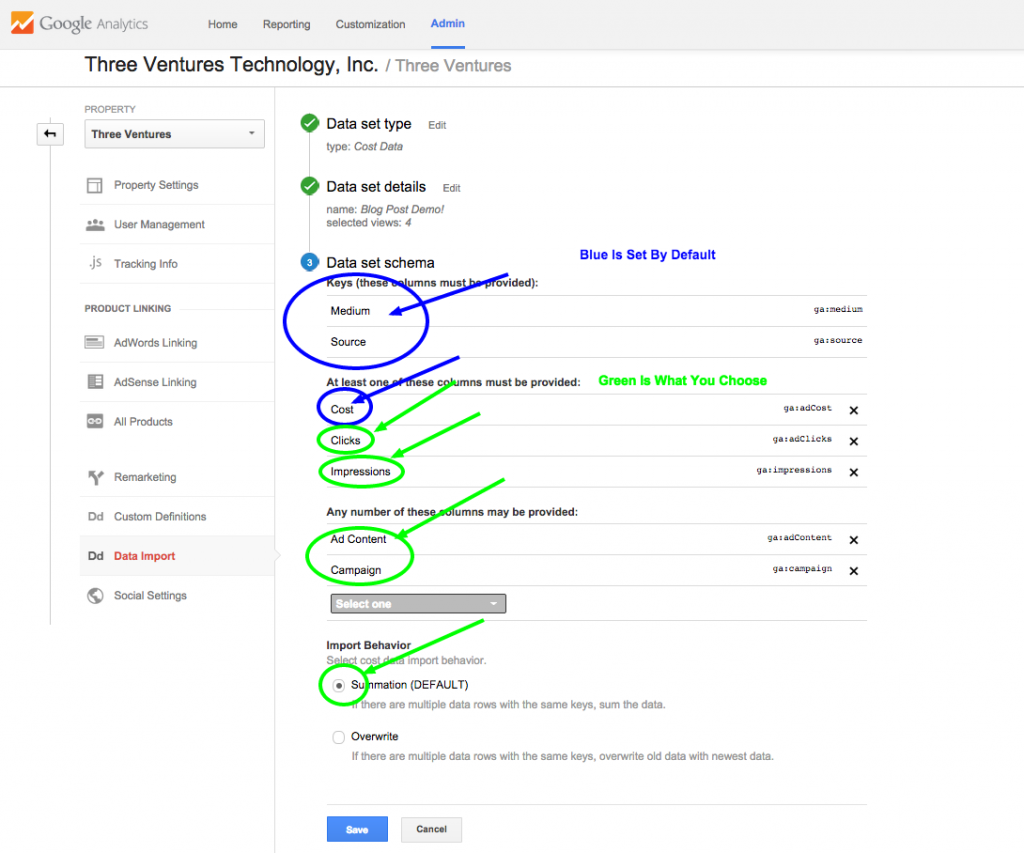
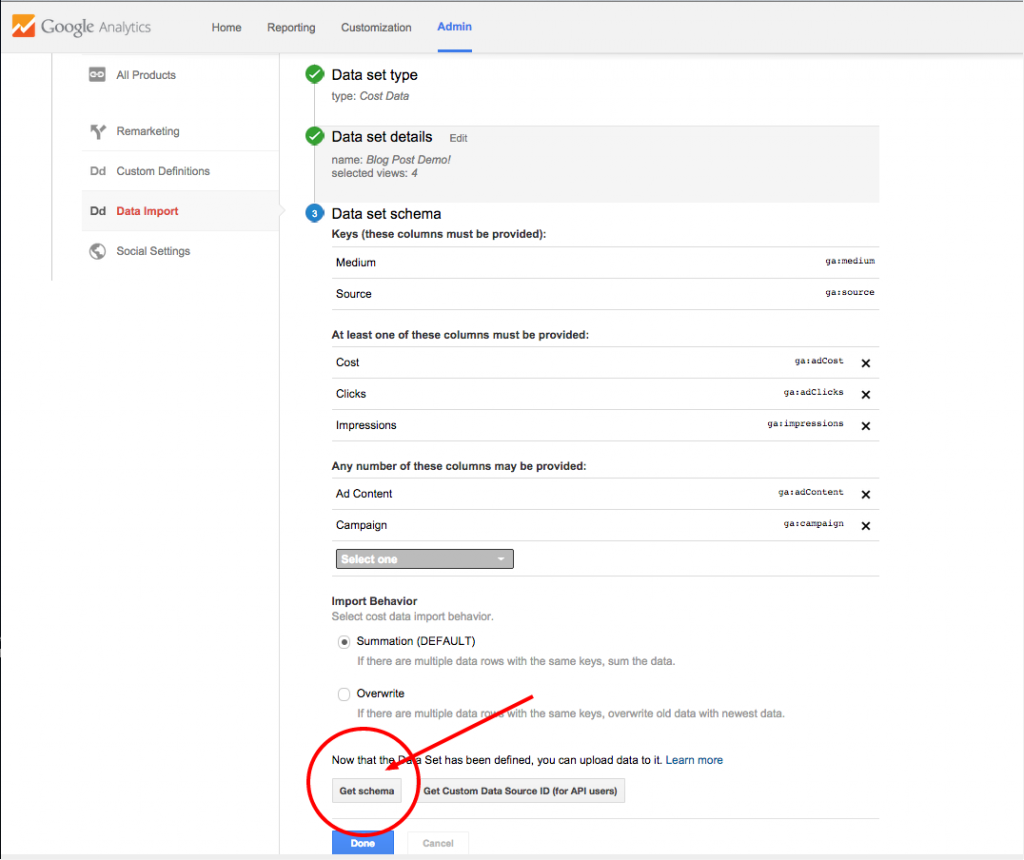
Ah, the data set schemas! Don't worry, that's just fancy talk for "What data should this be associated with and what are you uploading?". Under keys, source and medium are already selected for you. This means that you will always have to upload values for source and medium. Under "At least one of these columns must be provided:", this is where you select the data to upload that Google Analytics doesn't already have. For example, Google Analytics will never have cost, clicks, or impressions for non-Google paid campaigns. For this reason, we always select clicks, impressions, and cost. NOTE: if you don't want to import clicks or impressions, do not add these. Typically, clicks from paid social campaigns doesn't always mean website traffic. At Three Ventures, we like to import this data to see the click to session ratio (IE: 3 Ad clicks to every 1 session recorded in GA). We use this for when planning social media campaign budgets. BE WARNED, Every one of our FB paid campaigns that sent traffic directly to our site, and not a post or page, has always had more clicks then sessions recorded in GA. Under "Any number of these columns may be provided:" select 'campaign' as it is a required UTM parameter in every tagged link. We also recommend selecting 'ad content'. This is because you should be tagging all of our social links using the non-required UTM parameter for ad content. This parameter tells Google Analytics what ad the user clicked on to get to the site. In doing so, you allow Google Analytics to also associate clicks, cost, and impressions (Assuming you selected them), to your ads. This lets you calculate the ROI and ROAS for your ads (Which you will need to execute our growth hacking strategy below). Leave 'Summation' as the default, click save.
Creating Your CSV File To Upload - Step Two
This is the easy part. Creating your CSV file is a three step process as follows:
- Download your click, impression, and cost data from a paid campaign.
- Change column headings and row values to meet GA requirements.
- Remove unneeded data,
If you want to import data for a paid campaign, like a Twitter Ads campaign, download the campaign report. In the report, make sure the data is broken down by day, and includes at minimum:
- Ads In Campaigns
- Clicks, Impression, and Cost For Each Ad
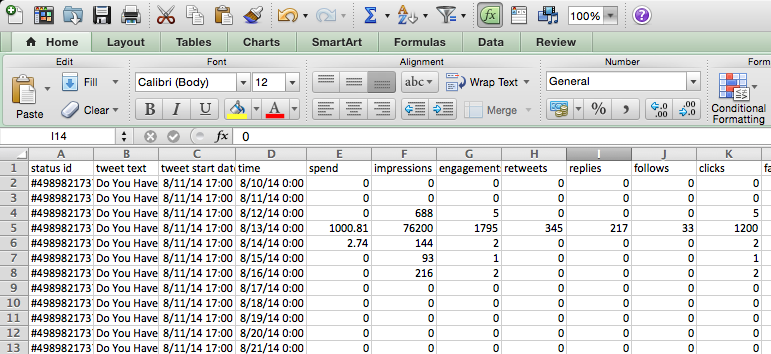
Don't worry, most report downloads do this for you. See the example of a Twitter promoted tweet campaign below. See how the data is segmented by date in every row, with multiple rows for each ad?
Next step is to identify which data you won't need. To do this, we need to go back to the data set that we created earlier (Login / admin / data import) and click on the name. You should see something like this:
See where it says 'Get Schema'? Click on that. The highlighted blue info is what you'll need identify what data the CSV is to include.
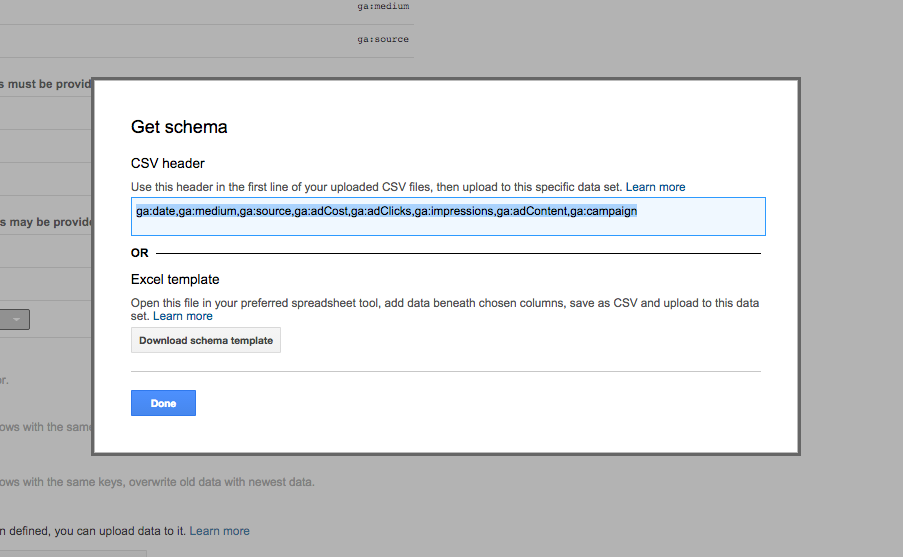
In the example from above, you would need:
- ga:date
- ga:medium
- ga:source
- ga:adCost
- ga:adClicks
- ga:impressions
- ga:adContent
- ga:campaign
However, looking at my report that I downloaded from my Twitter Ads campaign, I notice some differences in the data the report includes and what Google Analytics needs. Remember, Google Analytics needs two things to upload cost data: specific header values for the type of data, and data values to be in the proper format.
Formatting Rules For Cost Data Files
For column headers, use the name of the data schema values in order. From our schema set above, the first column would be for the date, so the first column heading would be 'ga:date'. For data values there are two stipulations:
- First, numeric values must always be 0 or greater, can't include commas, and can go up to two decimal places for cost values only.
- Second, date values must always be in 'YYYYMMDD' format. For example, the date of 11/11/14 would be '20141111'.
With these in mind, let's take a look at how we would format our Twitter Ads report from earlier.
Formatting A Cost Data File
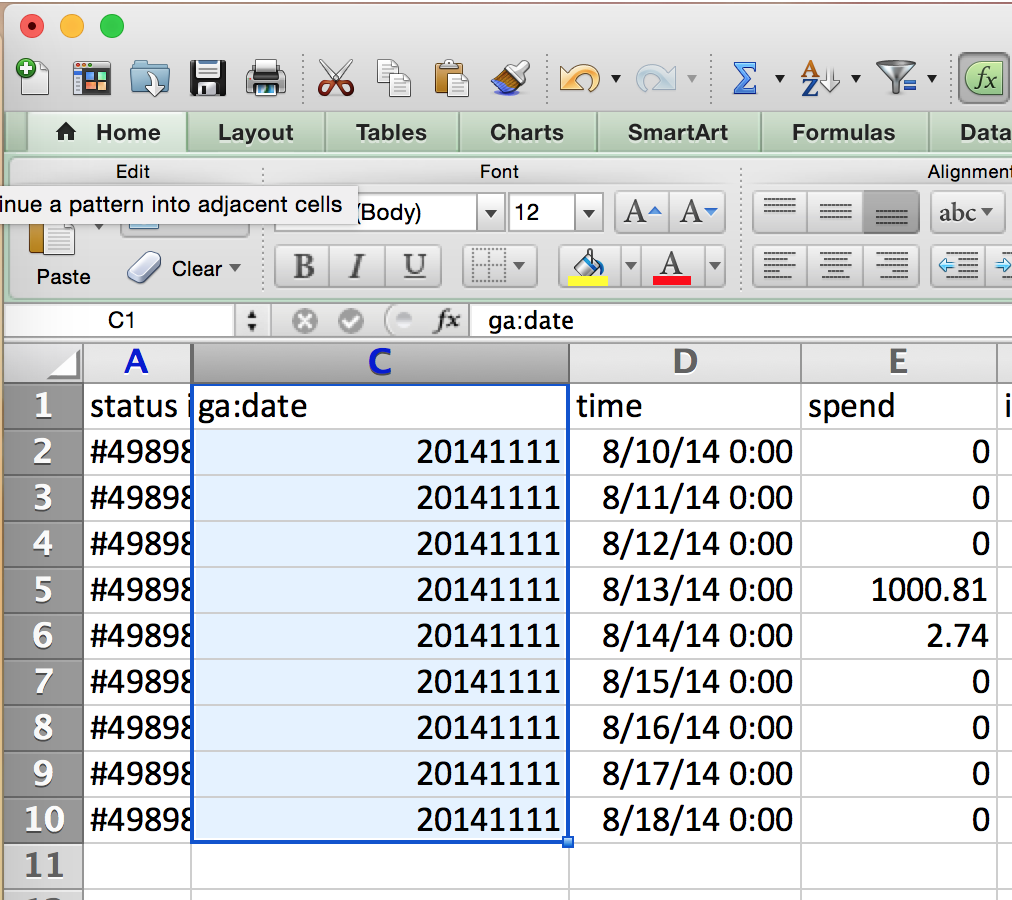
We're going to reformat each section of the downloaded report from Twitter Ads and provide visuals for you to follow along with. Let's start with 'ga:date'. Here's what our downloaded report from Twitter Ads looks like.

ga:date: all though I have the date, the values include the hour the ad started, which we don't need, the heading value isn't 'ga:date', and the format of the date is incorrect. We change the heading value to 'ga:date', the date values to YYYYMMDD format, and remove the hour value.
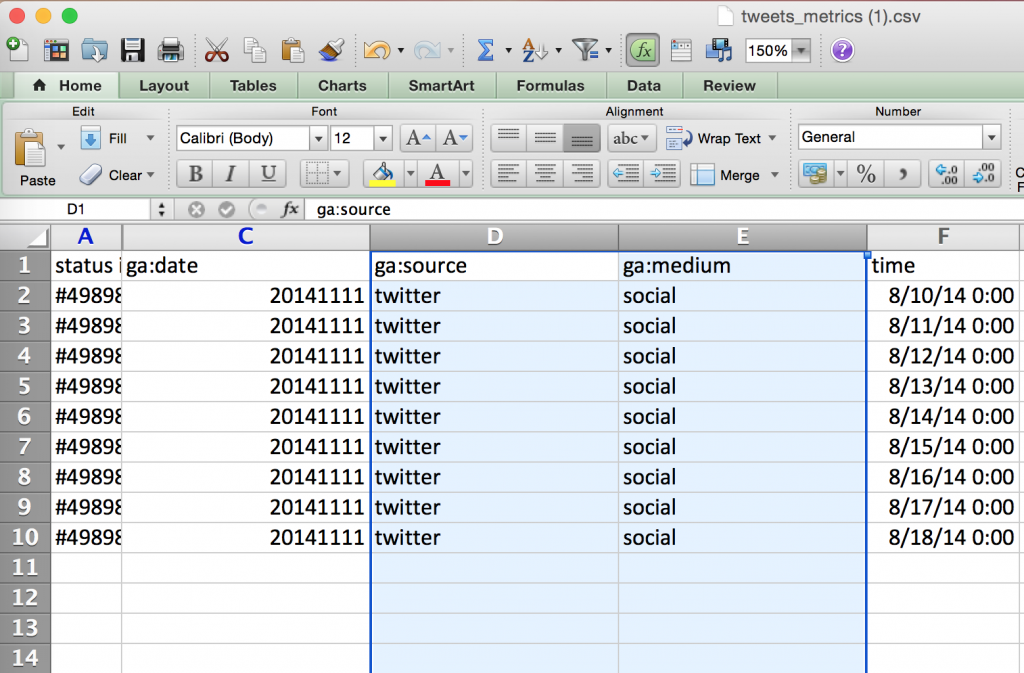
ga:medium & ga:source: oh no, we don't have any values for source or medium, we'll have to add these. Label the heading with the proper schema, check your link and see exactly what you put for source and medium (Remember this is case sensitive), then give the appropriate columns the value used.
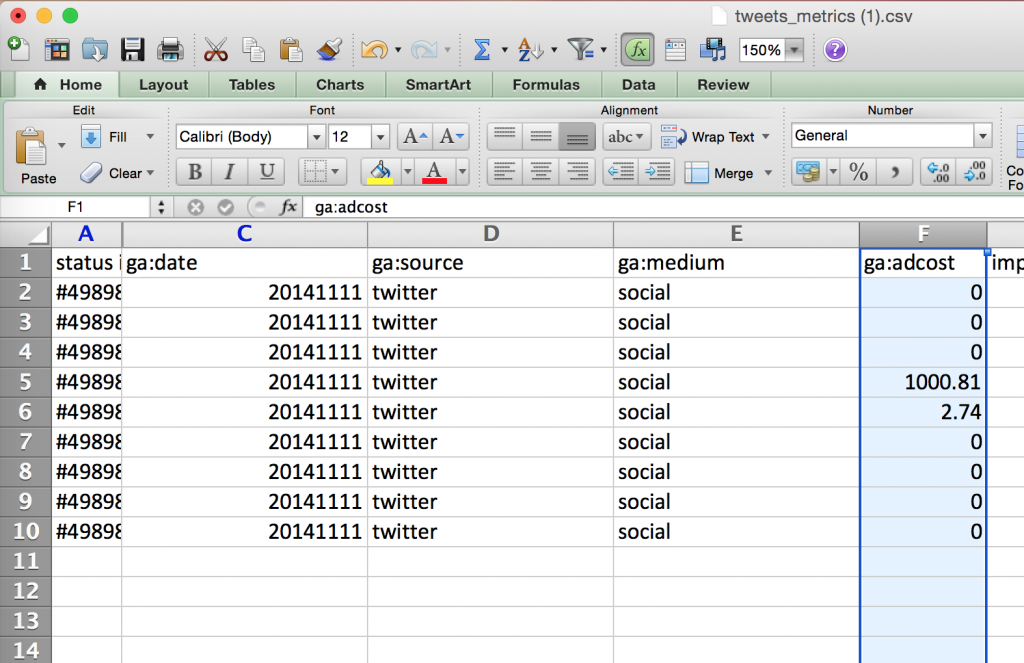
ga:adCost: looks like we already have a value for this under the 'spend' column in our report downloaded. Let's change the header value and make sure our values are in correct format.
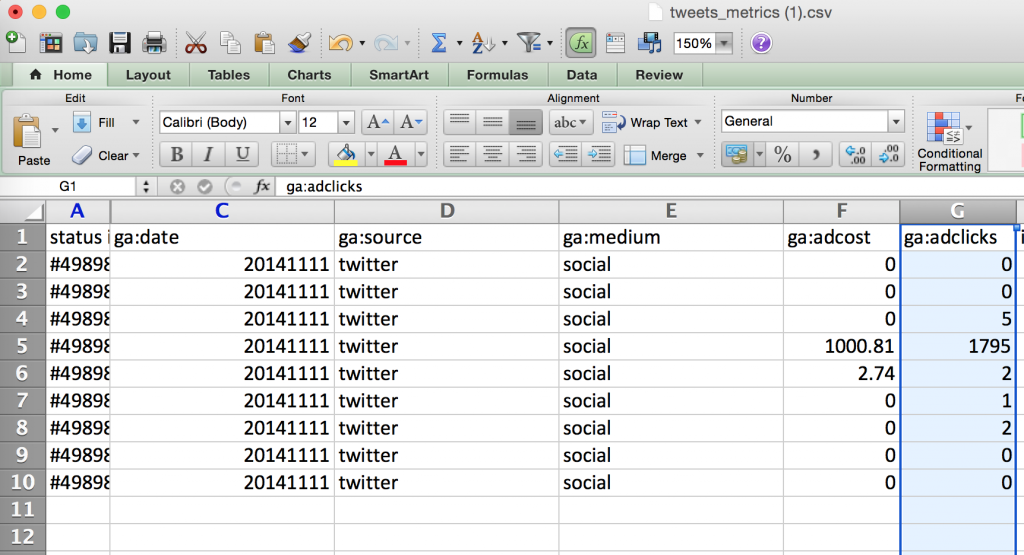
ga:adClicks: looks like we already have a value for this under the 'engagement' column in our report downloaded. Remember that this is how many times the ad was clicked (Favorite, clickthrough, retweet, or other). Let's change the header value and make sure our values are in correct format.
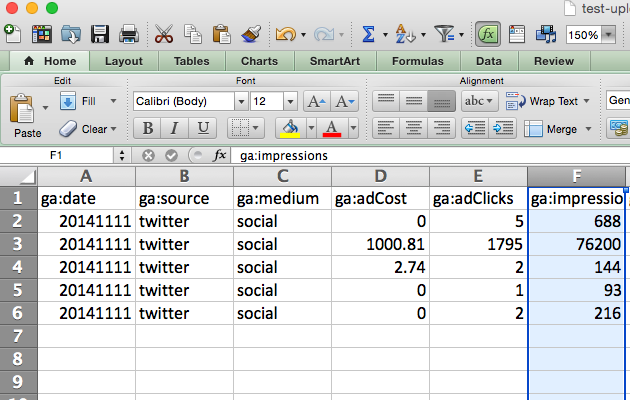
ga:adimpressions: looks like we already have a value for this under the 'impressions' column in our report downloaded. Let's change the header value and make sure our values are in correct format.
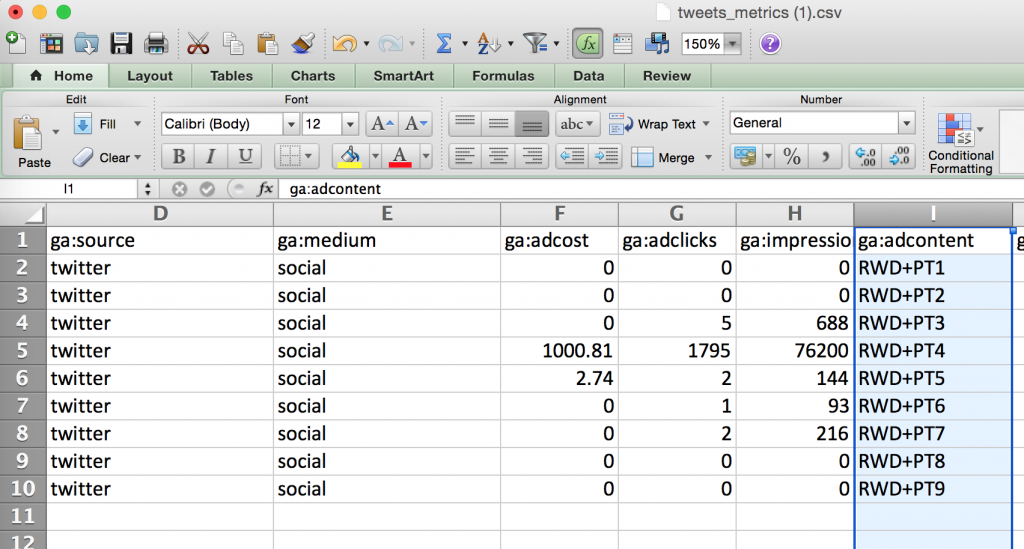
ga:adContent: looks like we already have a value for this under the 'tweet text' column in our report downloaded. However, I go back to the tagged link for for each ad because I didn't use the tweet text for the tag value. Turns out I used variations of RWD+PT for the ad content UTM parameter. Let's change the header value and make sure the values match up with our tagged link.
ga:campaign: looks like we don't have a column for this. Before I add one, I go back to my tagged links for each ad and check the UTM campaign parameter. Turns out I used 'RWDBP'. Let's change the header value and make sure our values are in correct format.
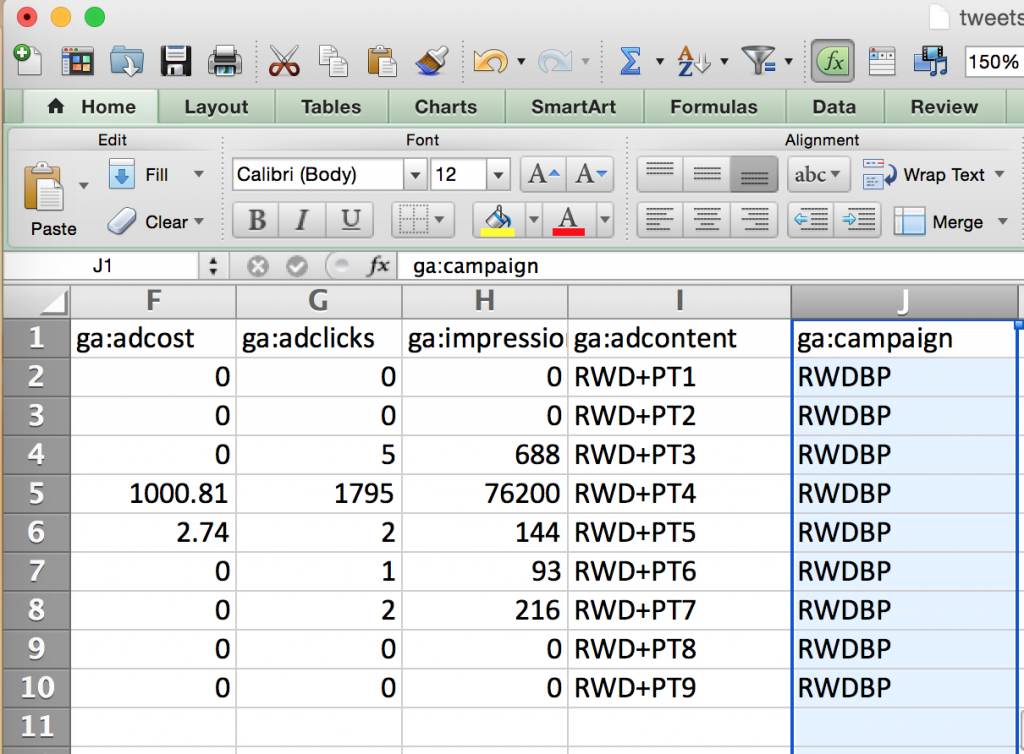
Great, now that I've labeled all the columns, checked my tags, and made sure I had the proper data formats, I'll need to erase any column or row that has data we don't need. For example, we don't need the column 'status id', or any row for an ad that doesn't have clicks, costs, or impressions. After removing, my report now looks like this.
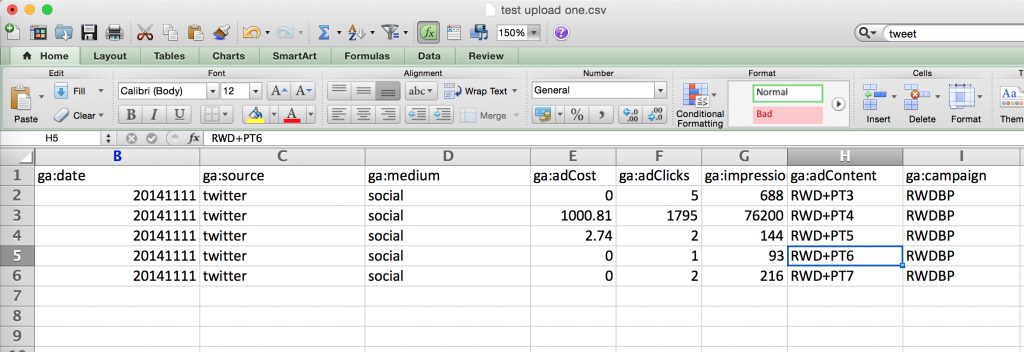
Awesome! Make sure the report doesn't include any other data (visible or not), and save as a '.CSV' format. Now head back to the interface and go to data import tool.
Uploading A CSV To A Data Set - Step Three
Once you get the the data import tool, find the data set you created and click manage uploads. You will be taken to a file uploader where you can upload your file. Once you do so, the file will have a 'pending' status in the status column. There are two possible results, GA accepts or rejects your file upload. Take a look at the image below where I purposely uploaded two files with the wrong column headings, then uploaded the correct file.
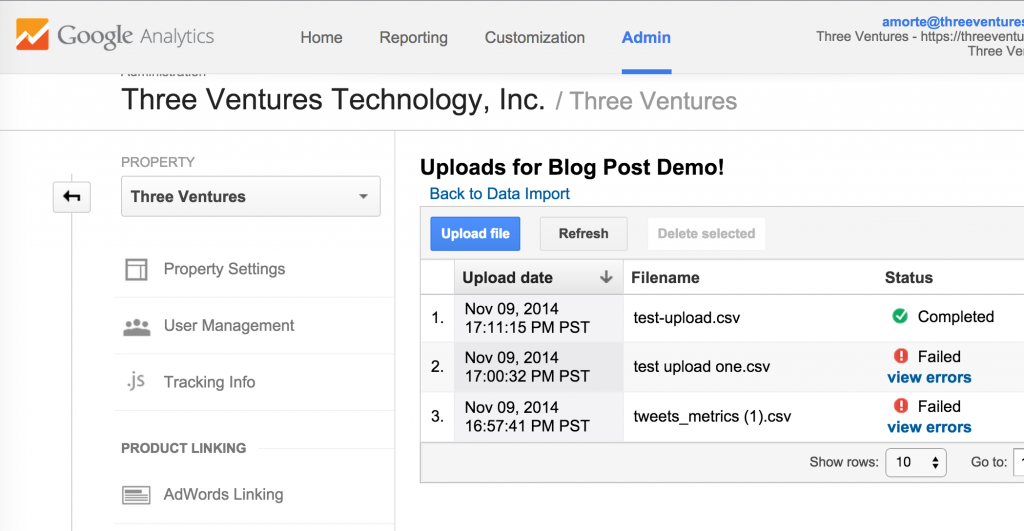
If you have a file that returns the status of 'Failed', the data won't be added. If the file is accepted, and you accidentally have the wrong values, you can select the delete checkbox and then click 'Delete Selected'. At this point, Google Analytics will remove all of the data you uploaded. That's awesome, because mistakes do happen, and unlike a filter, we won't corrupt our data if the file has incorrect data. NOTE: It does take some time for the data to upload, depending on the amount uploaded. Now it's time to move to the interface and show you how to use a custom report to automate reporting of social media ROI / ROAS, as well as how to do some 'Growth Hacking'.
Download This Social Media ROI Custom Report To Get Started
Download the report. This report will allow you to automate your reporting of Social Media ROI (Assuming you have uploaded it correctly), and allow you to do some growth hacking!
Automating Reporting of Social Media ROI in Google Analytics
Once you've downloaded the report from above, login to your GA account, and click 'customization' in the top level navigation. Look for the report you just downloaded and click on it. Wow, is that an awesome report or what?!

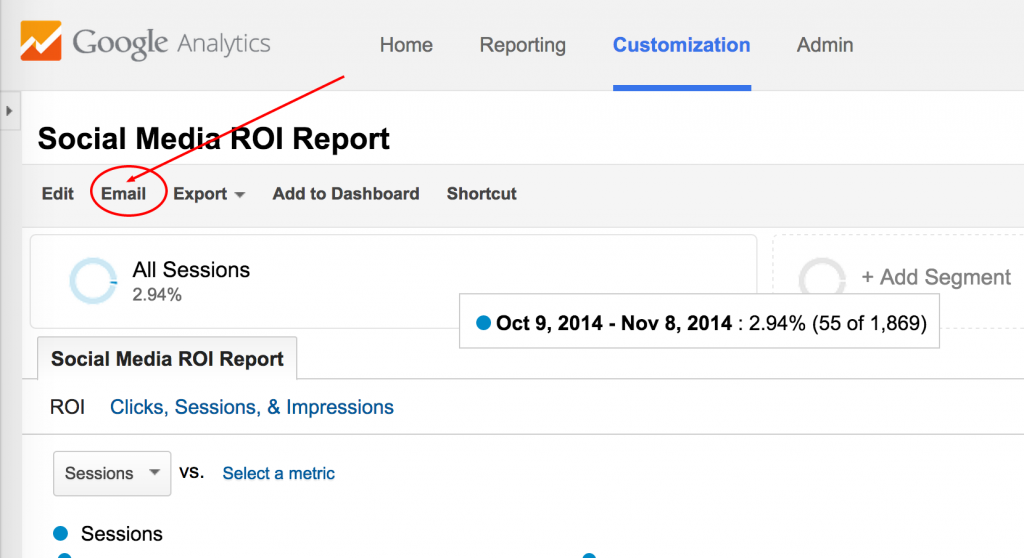
You get to see your KPIs for all social channels, which is exactly what most client's / bosses look for from marketers. If the site you're measuring social media ROI for is a lead generation site, make sure that you're measuring goal value in Google Analytics correctly. Once you do this, edit the custom report to include total goal value instead of revenue. Let's automate the emailing this report every month to the appropriate personnel. Start by clicking on 'email' in the sub navigation.
A modal should pop up that looks like this.
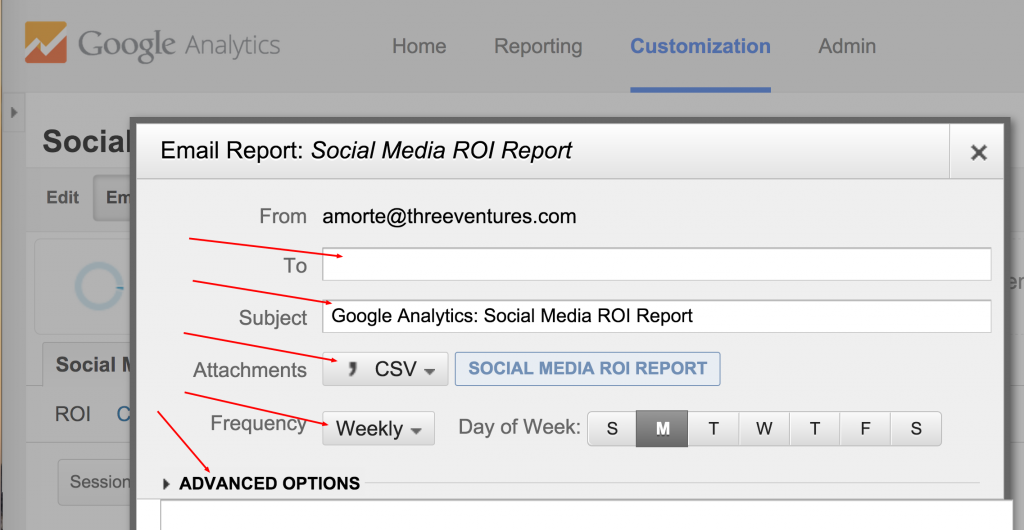
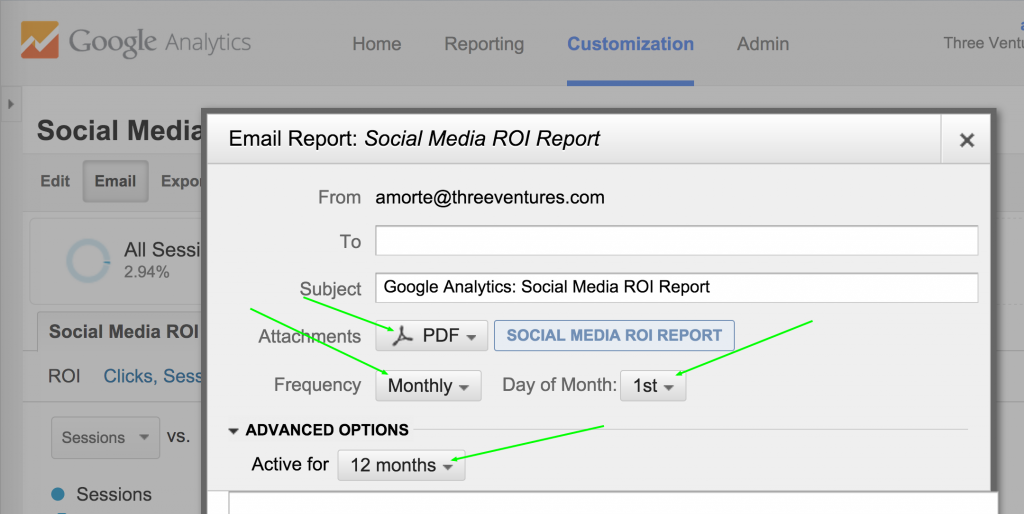
Put in your normal email fields and switch the 'attachment' value to 'PDF' that way your client or boss sees a nice, visual report. Under 'frequency', select monthly, and pick the day of the month you want it sent. Then open up the advanced section and select active for '12 months'. Your changes should now look something like this.
PRO TIP: Set a reminder in your calendar twelve months from today's date to update the automated reporting when it expires.
Growth Hacking Using Your New Social Media ROI Custom Report
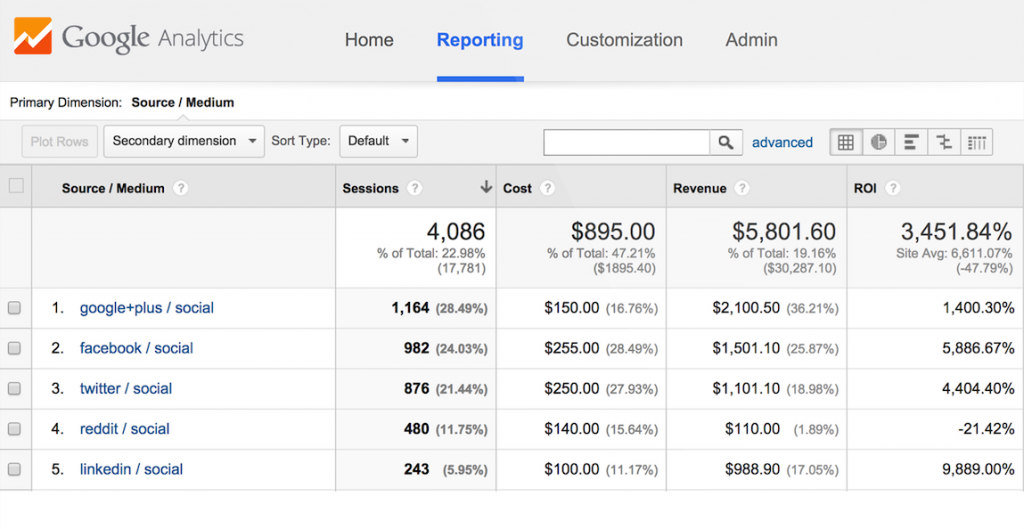
Way back at the start of this post, we talked about doing some 'Growth Hacking' using the report you just downloaded. Let's talk about how to do that. First, notice that this report is multi-dimensional. This means there are lower levels of data for each one of our social sources. So if you click on a source, you will then see all campaigns for that source. If you click on a campaign after doing this, you will then see all ads in that campaign. This is assuming you tagged your links correctly. Lets look at some visuals to show what multi-dimensional looks like. Here is what the report shows when you first open it.
Let's say you click on Google Plus.
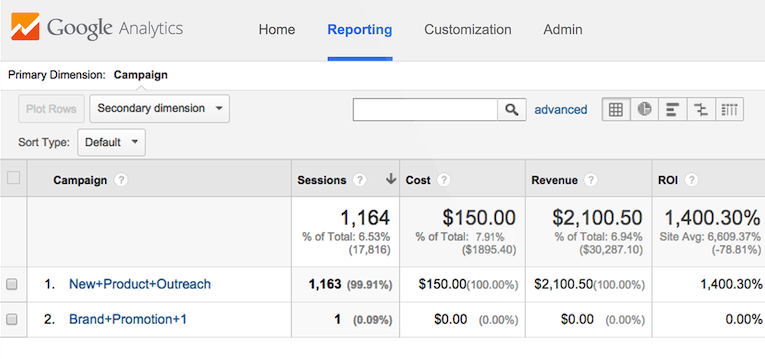
You would then go to the campaigns for Google Plus. Find the campaign you wish to do some growth hacking for and click on it.
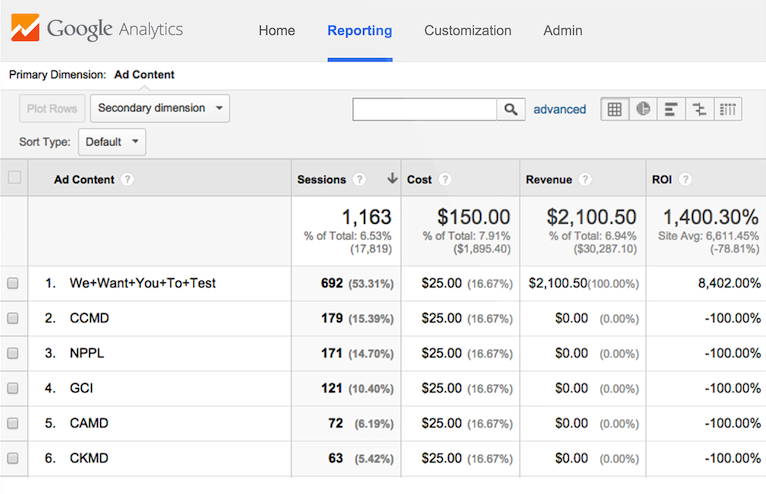
Notice all the ads, with their associated KPIs, show up in the report. This dimension (ad content) is where you will be able to do some serious growth hacking. I start by looking at my top converting ads. For this example, notice that the 'We want you to test' ad was our only ad that drove a positive ROI. This means all of my other ads didn't resinate well with my audience. From here I would head back to the drawing board and create more ads like the 'We want you to test' ad. I would then use the new ads, wait for some time (Maybe a few days), and revisit that data. Then repeat the same process. This allows social media marketers to continually change and improve ads based on those that already work. At Three Ventures, We use this strategy for all of our paid and owned efforts, as well as clients. It helps us drive more engagement and revenue at a price that provides value. Making sure that your work provides value, and is not a cost, is what will keep your clients or boss happy.
How To Measure Social ROI In Google Analytics - Wrap Up
Now when someone says "Let's face it, ROI is a term that most marketers sell on, but fail to report on data that proves it.", you should be reply "I'm not most marketers" and be able to prove your value. We've reviewed why tagging is so important, how to upload cost data, report on ROI, and growth hack your social channels. You should be able to apply this strategy at scale, and excel! For those of you who would like to automate as much of the cost data upload process as possible, feel free to use tools like Super Metrics and Analytics Canvas. We use both for different in-house and client reporting needs. Please, take the time to share this post for others. We spent over 20 hours preparing it in unison with @AlanMorte's presentation for SMX Las Vegas on this subject. It's meant to help digital and social media marketers use Google Analytics to measure social ROI. We appreciate you taking the time to read, share, or comment on this and hope to see you back on our blog soon. Interested in working with Three Ventures for your project? Contact us to learn more. References available upon request.


