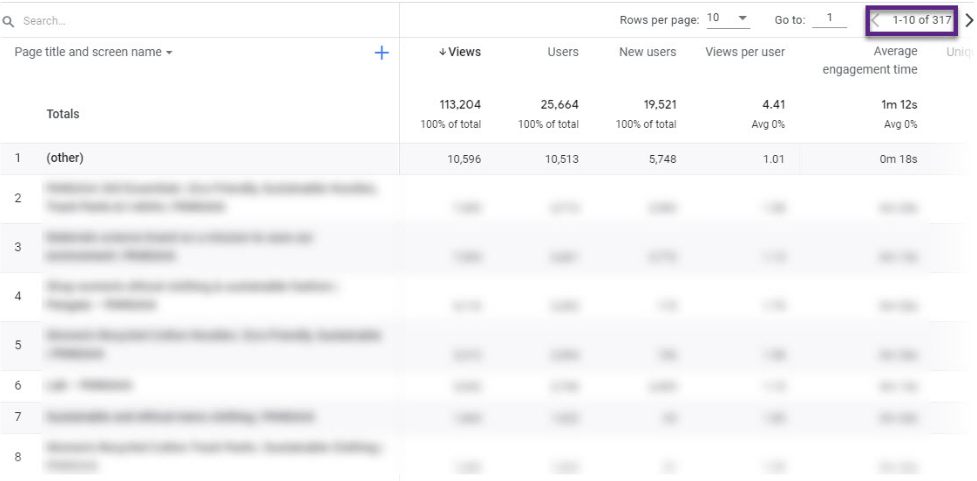
The “Other” result has been appearing as a value under the Primary Dimension for key reports such as Landing Page, Source/Medium, Channels and many more. By combining two or more values under “Other” these reports render analysis and valuable insight generation difficult if not impossible...
Why is this Occurring?

Two issues are at play here. One is cardinality, the other thresholding, and both are related to each other, as we explain below.
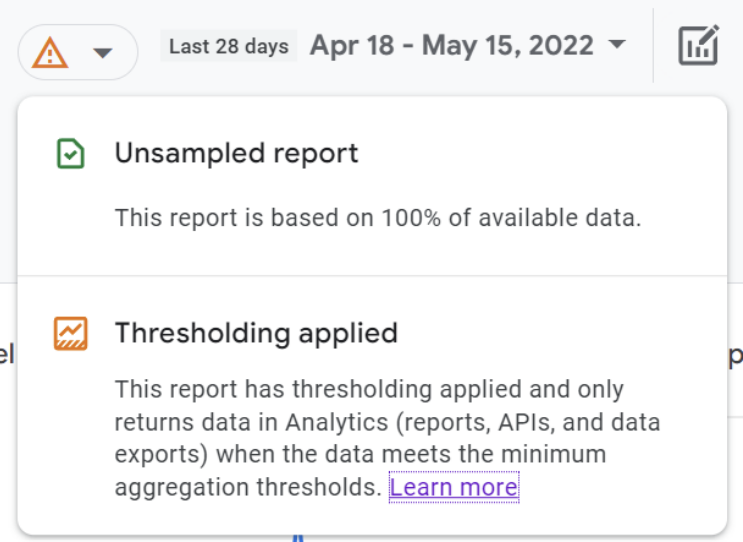
Thresholding is applied to your GA4 account whenever individual users might be identified by the data shown in a report. Thresholding generally happens when reports segment data with dimensions that include demographic data or other affinity attributes.
Cardinality causes similar issues as thresholding, but GA4 does not warn you with a nice icon when high cardinality is ruining your data. What occurs when you have a problem with high cardinality is that a large percentage of your data falls in the “Other” dimension. In some cases up to 95% of your data!
Privacy laws compel Google to inhibit analytics users from identifying a unique user’s experience on their data platform, for fear that analysts could combine this analytics data with distinct CRM data and correlate personal identifiers like name and email, with website activity. For example, a website visitor downloads a PDF on your website and provides their name and email. When that unique personally-identifying info gets sent to your CRM, it may also include the PDF downloaded, the traffic source driving them to the site, their location, etc.
When the user is equipped with a lot of dimensions (High Cardinality) it makes it easier for analytics data to be segmented as such to identify that unique user, for the purposes of gleaning additional information, such as device used, location, time on site, other pages visited, etc.
Why are Thresholding and Cardinality a Problem?
Protecting user privacy is a core tenant of Google’s guiding principles. Google has built dozens of privacy and security measures within GA4, Tag Manager, and other platforms, and will continue to focus on privacy in the coming years and months.
What we know right now is that the value “Other” appears due to controls applied by Google to obscure data results that sink below the threshold of what Google considers safe for user privacy. Think of it as a data inhibitor. If the number of the result gets too low by Google’s preference, the control kicks in and obscures the result by combining other dimensions into one “Other”. It is not known what limits or values Google is using as specifics have not been provided.
Google has controls in place to limit the retention of data related to user-level and event-level data. In Google Analytics 4, user-level data has a default retention of two months, which can be switched to 14 months. Event-level data also has a two-month default, which can be changed to a limit of your preference.
How Does Three Ventures Solve Thresholding and Cardinality Problems for their Clients?
Our goal for any solution is to weigh the needs of our clients with the capabilities and limitations of the platform they are using. With Google Analytics 4 data, Google has anticipated the increased focus and attention on user privacy by building a robust connection to BigQuery. We believe BigQuery plays a critical role in helping our clients generate valuable insights from their analytics data.
What is BigQuery?
BigQuery is a data warehouse that is used to store, manage, and analyze large amounts of data. With BigQuery you can:
- Consolidate data from multiple sources – no more silos!
- Own Your Data. Storing data in BigQuery gives you ownership of the raw data, rendering the cardinality and thresholding problem null and void once the data is stored in BiqQuery, only you can decide what data is removed, deleted or altered.
- Keep costs low. It is relatively inexpensive to store your data in BigQuery, and you are only charged when running queries.
- Connect data to other platforms. BigQuery serves as an excellent data source for other platforms, like data visualization (Data Studio, Tableau), Customer Data Platforms and other cloud services like Azure and AWS.
How Does Three Ventures Set Up BigQuery?
Setting up an initial BigQuery connection in GA4 is pretty straightforward. Three Ventures assists with setting up your initial connection and configuring your Google Cloud Platform account to receive the data.
Step 1: The GA4 to BigQuery connection only sends the raw data stream to BigQuery. Our team creates optimized reporting tables on top of the raw data. Querying the raw data is possible, but it requires writing SQL queries that take longer to run and require more processing power. Optimized reporting tables letsyou simply choose the data you want without writing an SQL query. This optimization step lets you run faster queries and consume less processing quota.
Step 2: Connect a reporting tool to your BigQuery data. We set up reports in Google Data Studio that make the best use of your BQ data or we can set up reporting in any other Business Intelligence tool.
What are the Costs for BigQuery?
The monthly costs for BigQuery are relatively low. Depending on your traffic fees range from free to around 40 USD per month. We are happy to provide an estimate for these costs based on your actual data. Our team can optimize your BigQuery database to lower the costs even more, which is especially important when you have high traffic volumes.
Does BigQuery Work with Most Third party Reporting Tools?
Most tools have built-in connectors for BigQuery. If a reporting tool you use does not have a built-in integration, we can set up custom connectors.
We know the addition of BigQuery to your analytics stack can be seen as another hurdle to generating insights in an area with a lot of hurdles already. But, we believe putting this key piece of the puzzle in place now will expand your flexibility and adaptability for the future and will speed up your ability to generate quality insights from your data.


