


If you haven't already, read our previous post about how to take control of your marketing channels with Google Analytics. This post covers what the Google URL builder is, how to use it, and Three Ventures' best practice strategy for implementing into marketing channels for data segmentation. This post is meant to be a follow up on how to visualize the data that you have already captured, given that you have implemented the tracking strategy from our previous post.
The Power Of The Google URL Builder and UTM Parameters
In summary, how to take control of your marketing channels with Google Analytics identified key questions that digital marketers face, I.E how to track channel performance to measure ROI and ROAS. It discussed and broke down how to capture the required data for segmentation of marketing channels and touched on some campaign optimization strategies. To further expand on optimizing marketing channels from data captured with the Google URL builder, this post focuses on segmenting channel specific data into custom dashboards using Google Analytics.
What Is A Custom Dashboard In Google Analytics?
A custom dashboard in Google Analytics allows you to build 12 widgets to segment and visualize marketing channel data in a single view. You can build up to 20 custom dashboards per profile for the base versions of Google Analytics and Universal Analytics. These dashboards can be kept private to you, public to everyone who has access to the related profile, and can also be shared with other Analytics Professionals via the solutions gallery. At Three Ventures we traditionally use dashboards to show marketing channel performance, website / application monitoring, revenue statistics, etc. In this post we’re going to focus on marketing channel performance, specifically for the mediums of email.
How Do Custom Dashboards Help A Digital Marketer?
Custom dashboards can report on marketing channel KPIs all inside of a single view. With so much data in Google Analytics accounts, it can become a time consuming task for marketers to get statistics on key performance indicators. A custom dashboard solves all of that.
We Need Custom Dashboards Yesterday!
Custom dashboards in Google Analytics are a great way to minimize time spent analyzing data because they report specific data for a channel that you select. However to get these key pieces of data, you must first plan out your custom dashboard needs. Much like my previous post leading up to this, I’m going to ask that you take some time and understand the importance of planning and setting up custom dashboards properly.
Planning To Build A Custom Dashboard
When beginning to plan a custom dashboards at Three Ventures, we identify the specific client's top channels. These channels typically include:
- Organic Search
- Paid Search
- Social Media
- Referral / Affiliates
- Display
- Retargeting
- Direct
- Etc.
After we identify the marketing channels, we ask:
- What are the goals of the channel?
- What is the budget of the channel spending, if any? What’s the demanded ROI / ROAS?
- What are the KPIs specific to this channel?
If you’re an agency, you can set up a meeting with clients to help you answer these questions above. If you work for a large organization or corporation, we recommend that you talk to marketing managers, project managers, and c-level executives if you have access to them. Understanding the KPIs that these titles use to determine success or failure will help you build dashboards around them. After we identify channel specific key performance indicators, we ask:
- How will this data help us manage and improve channels efforts?
- Who in our organization or in the client’s organization could benefit from having access to this data?
- How often should we report this data to clients?
This helps us understand how often we should be monitoring the dashboard, who is to get weekly / monthly reports of the dashboard, and who should have access to it.
Building Custom Dashboards Around Channel Specific KPIs
Now to the fun part, building custom dashboards! In this section we're going to break down how to build a dashboard for email marketing. If you have tagged all of your links with the Google URL builder strategy discussed in our previous post, you should be able to beautifully segment and visualize all of your email marketing data in Google Analytics (Assuming you use email marketing, if you don't, we can help you get started). To build this dashboard, we're going to answer the questions from above, implement dashboard widgets to segment email data, discuss reporting best practices, and provide you with a link to download Three Ventures' email marketing dashboard directly into your Google Analytics account.
Three Ventures' Email Marketing Custom Dashboard For Google Analytics
To help identify channel specific KPIs start off by answering the questions from above.
- What are the goals of the channel? - Typically we see email marketing goals being visit, transaction, and revenue related.
- What is the budget of the channel spend? What’s the demanded ROI? - For email marketing, calculating ROI can be tricky as costs incurred by the entity are usually sending, creation, and employee time. Typically our clients like to see revenue generated so they can calculated ROI internally.
- What are the KPIs specific to this channel? - At Three Ventures, our on-site KPIs for email marketing normally include visits, bounce rate, transactions, revenue, and conversion rate. We like to break these down by sources and campaigns.
- How will this data help me manage and improve channels efforts? - This data typically provides us with an email marketing overview to spot trends / issues for further analysis. It also keeps us constantly informed on channel performance and current campaigns running.
- Who in my organization or in the client’s organization could benefit from having access to this data? - We like to provide our account managers and client employees responsible for the select channel shared access to the dashboard. This allows for easy view ability of channel performance.
- How often should I report this data to my boss and or clients? - At Three Ventures we base this one off monthly revenue generated. A rule of thumb that we follow is 10K or less monthly revenue: Monthly reports, 10K-100K: Weekly and monthly reports, 100K+: Daily, weekly, and monthly reports.
Pro tip: be careful with daily reporting. Most people don’t like to deal with lots of emails. Next we're going to cover how to build a custom dashboard from scratch. If you would like, you can skip the how-to and import the pre-built dashboard directly in to a Google Analytics profile you have access to.
Building An Email Marketing Dashboard For Google Analytics
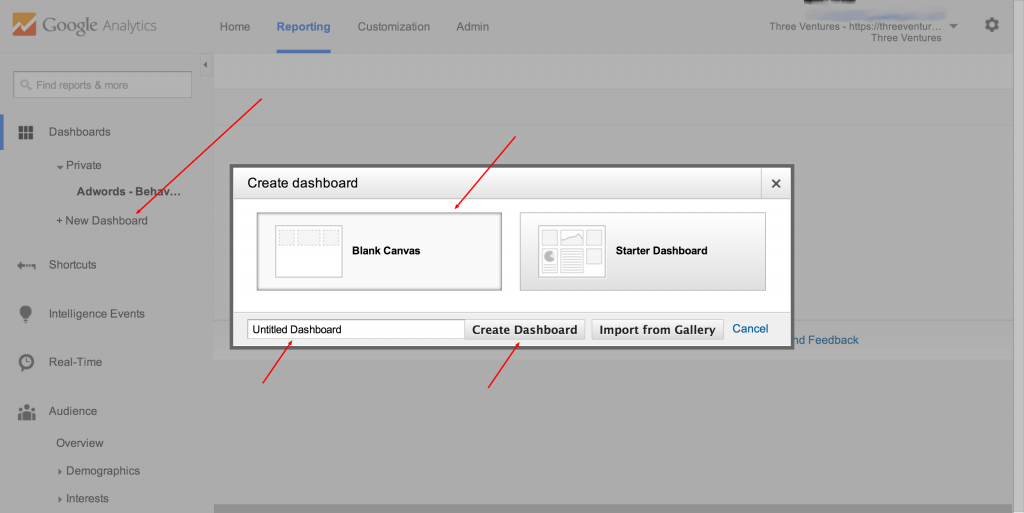
To start, login to your analytics account and select the property and profile you wish to build the dashboard under. Once logged in, click on the dashboard drop down on the left hand menu and click new dashboard, select blank canvas. Name the dashboard ‘Email – ABC’. ABC stands for acquisition, behavior, and conversion. Click create new dashboard.
Adding Email Visits, Transactions, and Revenue Widgets
The first widget you build will contain all visits from the source / medium containing ‘email’. Remember that email is a medium, not a source. This is because you can have different types of emails that are sent to customers or clients. For example, the source for one type of email could be ‘reminder’, with the second source being ‘newsletter’, yet both still come from the medium of email. To get started, click, ‘add widget’.
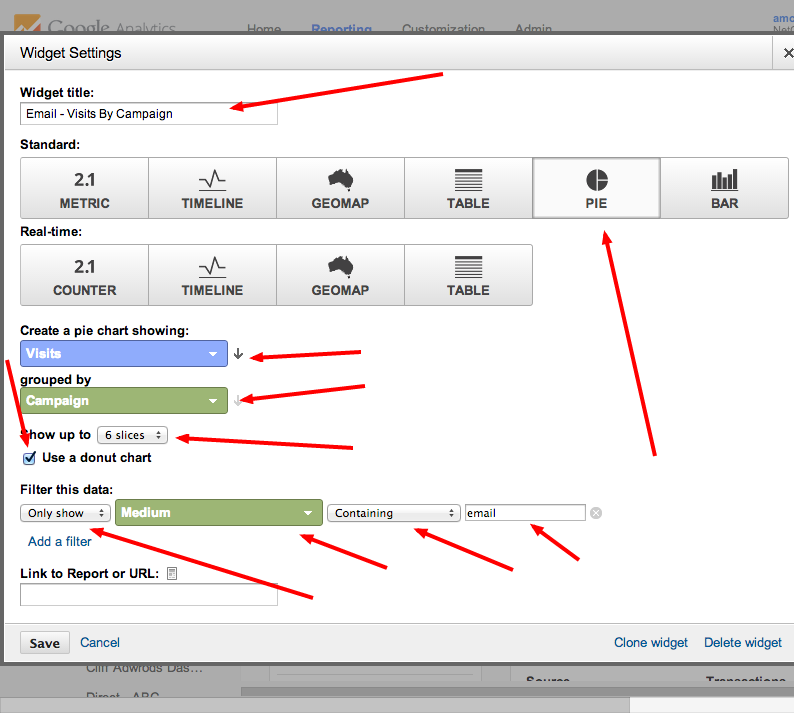
- Select the Pie widget under standard. Be sure not to use ‘Real Time’ as this is not a real time dashboard.
- Give the widget the name of ‘Email – Visits By Campaign’.
- For ‘Create a pie chart showing’, select ‘visits’.
- For ‘grouped by’, select ‘campaign’.
- For ‘Show up to’, select 6 (This will show up to six different campaigns that send email visits).
- Select the ‘Use a donut chart’ option.
- For ‘Filter this data’ select (In left to right order): only show, medium, containing (This makes the input value non-case sensitive), email.
Compare your configurations to the image below. Click Save.
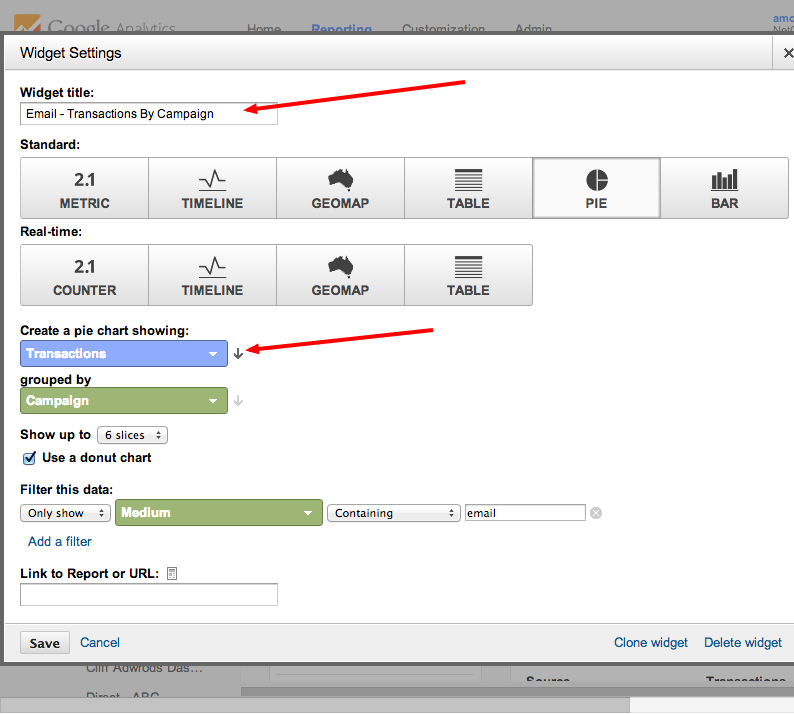
Now let's set up a widget for revenue. To do this, we'll clone the widget we just made.
- To clone a widget, roll your mouse over the one you want to copy. In this case ‘Email – Visits By Campaign’. You should see a little pencil icon appear in the upper right hand corner of the widget.
- Click the icon, and when the widget opens up, the bottom right hand corner of the widget will have a link that says 'Clone Widget', click the link.
- Now roll over the widget you just cloned and click the pencil icon.
- Since the widget already filters the data to include email traffic, all we need to change is ‘Widget Title’ and ‘Show The Following Metric’.
- Change the widget title to ‘Email – Transactions By Campaign’ and change show the following metric to ‘Transactions’.
Compare your configurations to the image below. Click Save.
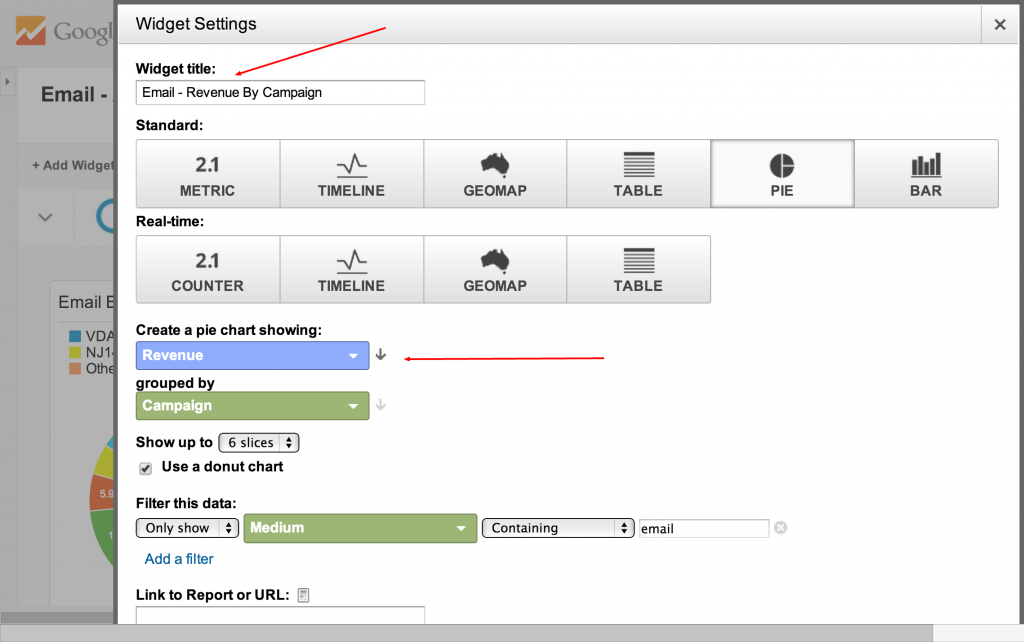
Again, roll over the widget you just cloned and click the pencil icon. Since the widget already filters the data to include email traffic, the only things you need to change are ‘Widget Title’ and ‘Show The Following Metric’.
- Change widget title to ‘Email – Revenue By Campaign’.
- Change show the following metric to ‘Revenue’.
Compare your configurations to the image below. Click Save.
Adding Email Marketing Widgets By Source and Campaign
In this step you will set up six table widgets. These tables will break down visits, bounce rate, transactions, revenue, and E-commerce conversion rate by source and campaign. You'll start off by building three table widgets for sources, and then three more for campaigns.
- Roll your mouse over the ‘Email – Visits By Campaign’ pie graph widget.
- Click the pencil icon, and then clone widget.
- Roll over the widget you just cloned and click the pencil icon to edit.
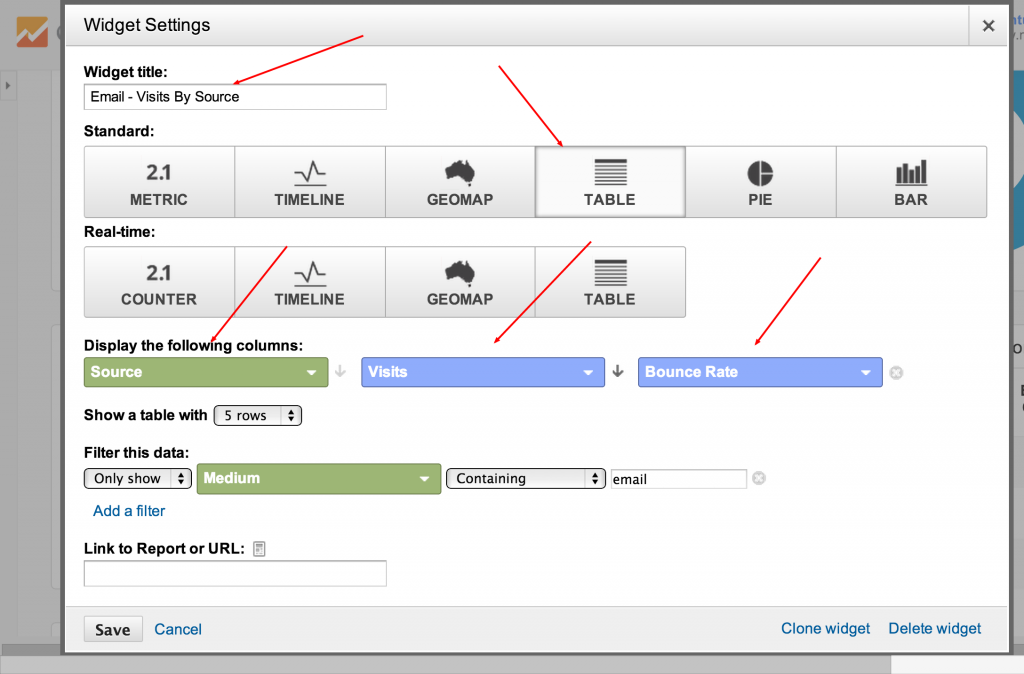
- Rename this widget ‘Email – Visits By Source’. Then change the widget type to table (Make sure that it’s a standard widget and not a real time widget).
- Select 'source' in the green column (Dimensions)
- Select 'visits' in the blue column. Click add a metric next to visits and select bounce rate.
Match your configuration to the image below. Click save.
Next, clone the widget you just made.
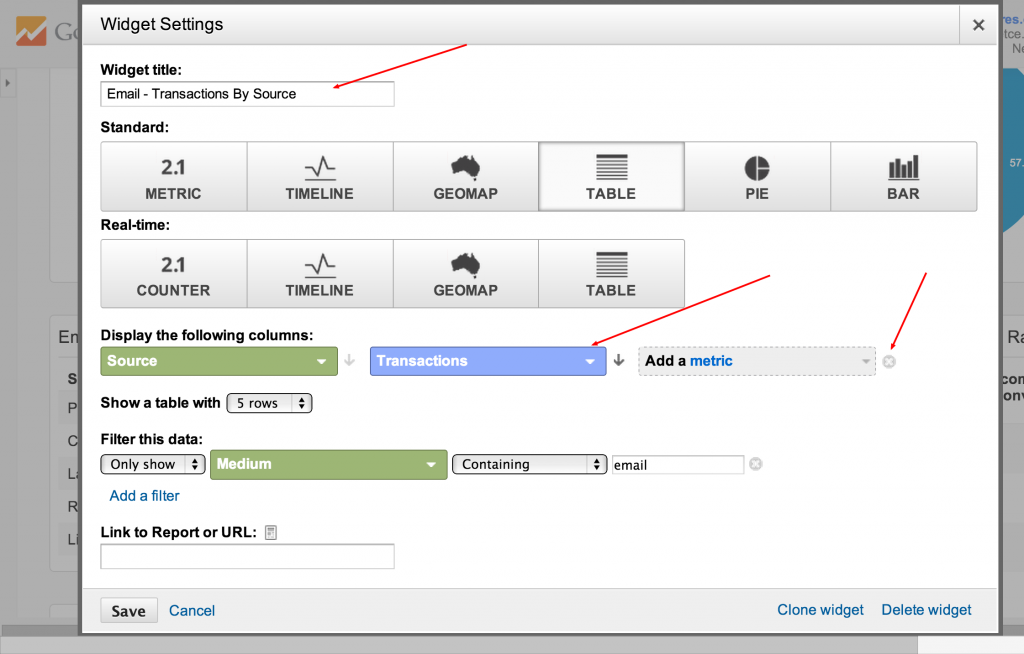
- For the first cloned widget, change the title to ‘Email – Transactions By Source’.
- Delete the bounce rate metric by clicking the grey x next to it.
- Change the visits metric to ‘Transactions’.
Compare your configuration to the image below. Click save.
Next, clone the widget 'Email - Visits By Source'.
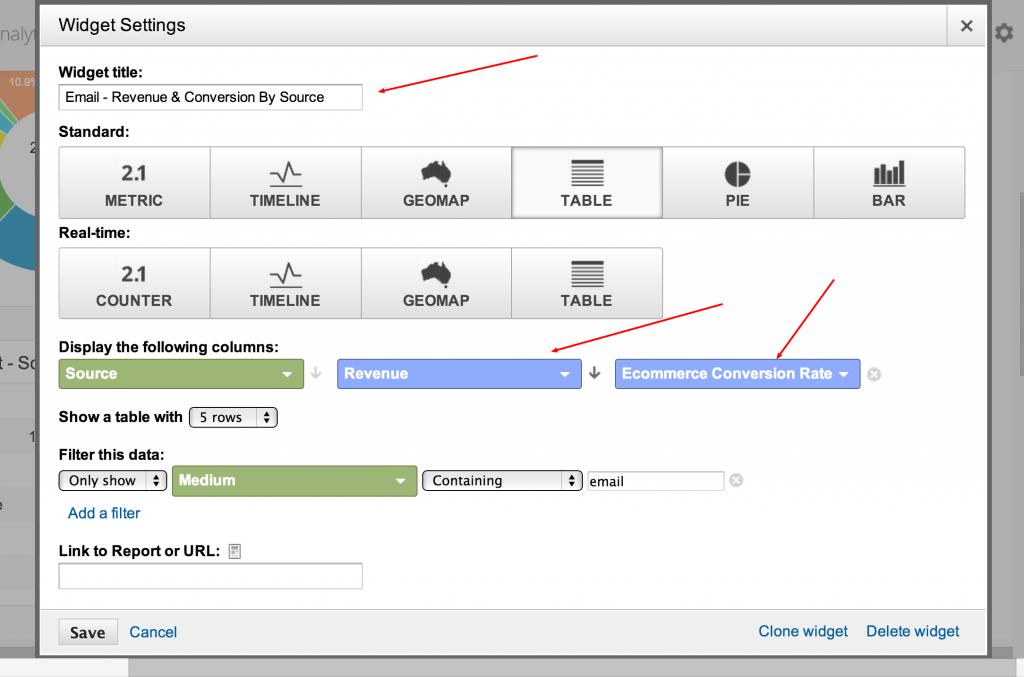
- Change the widget title to ‘Email - Revenue & Conversion By Source’.
- Change bounce rate to ‘Ecommerce Conversion Rate’.
- Change visits to ‘Transactions’.
Compare your configuration to the image below and click save.
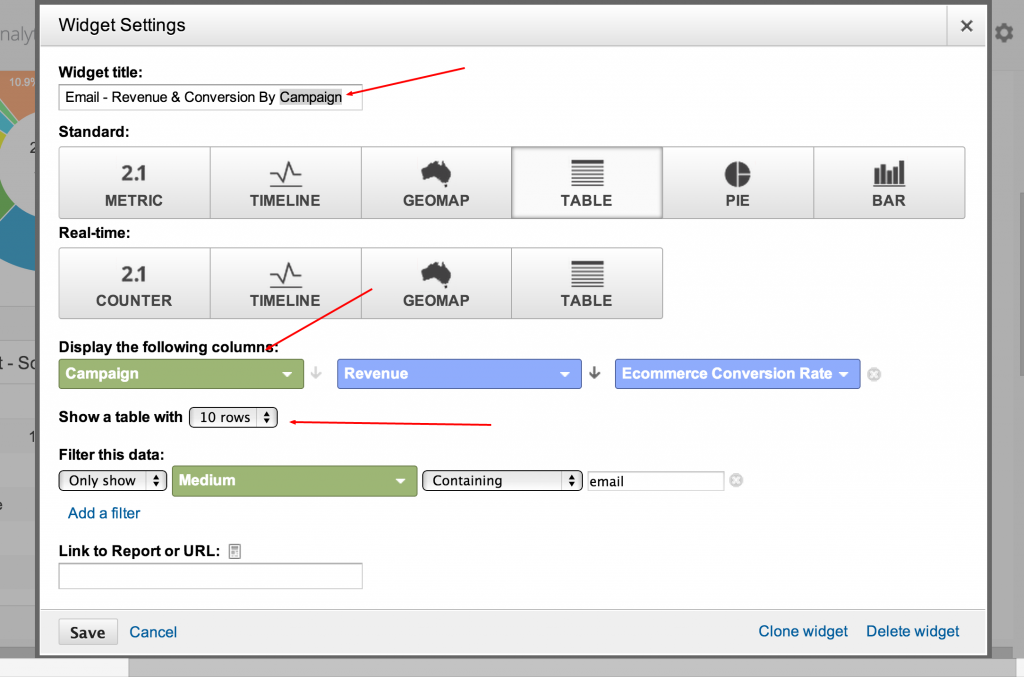
You should now have three table widgets that are displaying source information for: visits, bounce rate, transactions, revenue, and E-commerce conversion rate. Clone all three of the table widgets you just made. Modify the following in each of the new widgets:
- Change ‘Source’ in the widget title to ‘Campaign’
- Change ‘Source’ under display the following items to ‘Campaign’
- Change ‘5 Rows’ to ’10 Rows’ under show a table with
Reference the image below to see all the fields that you will need to change.
Arranging Dashboard Widgets To Help Visualize Email Marketing Data
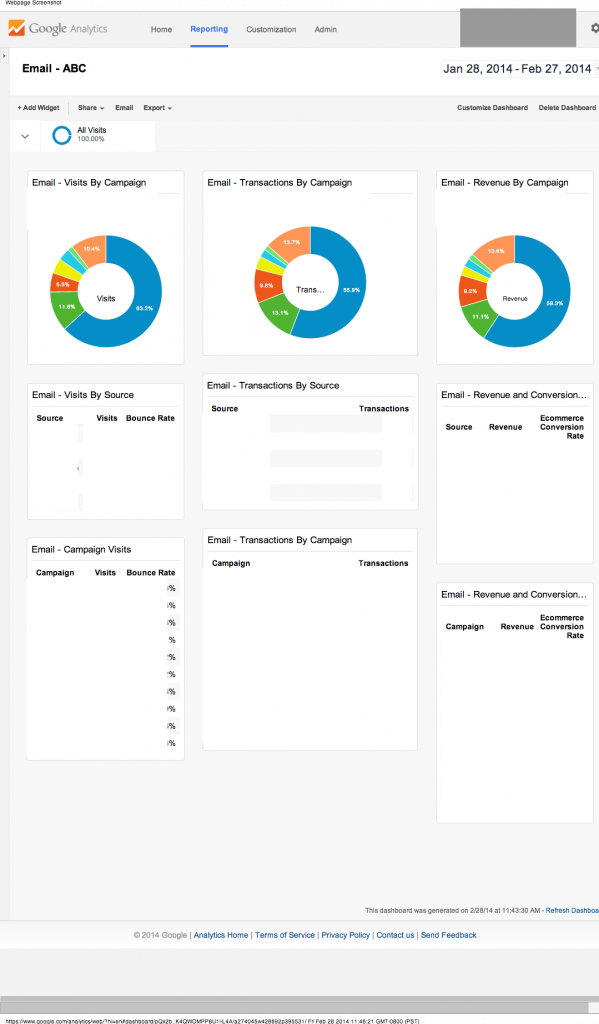
So how can these widgets help you manage and improve channels efforts? When the widgets are set up into three columns of visits, transactions, and revenue, the dashboard will provide quick and easy insight into email marketing performance. I find it most optimal to place visit widgets on the left, transaction widgets in the middle, and revenue widgets on the right. To move a widget, roll your mouse over the title, a movement arrow should appear, then click and hold to move it. In the left column, start with the pie widget of ‘Email – Visits By Campaign’, then ‘Email - Visits By Source’, and then ‘Email – Visits By Campaign’. In the center column, start with the pie widget of ‘Email – Transactions By Campaign’, then ‘Email - Transactions By Source’, and then ‘Email – Transactions By Campaign’. In the right column, start with the pie widget of ‘Email – Revenue By Campaign’, then ‘Email - Revenue By Source’, and ‘Email – Revenue By Campaign’. Your dashboard layout should look like the image below. Note that you will not be able to see data from this screenshot as I was not given permission to publish our email marketing data. Also, the download link for the dashboard you just built is available at the bottom of this post for comparison.
Sharing A Custom Dashboard In Google Analytics
To share a custom dashboard, make the dashboard public. To do so, make sure that you’re viewing the dashboard you want to share. In the sub navigation under the dashboard title, click the ‘Share’ menu drop-down and select ‘Share Dashboard’. You should now see a copy of the dashboard under ‘Dashboards’ in the left hand menu. Notice that your copy will still remain in the ‘private’ section. After sharing, every user associated with the account will be able to see the dashboard, however, only you will be able to make changes.
Setting Up Automatic Email Reporting For Custom Dashboards
To set up an automatic email reporting, go to the dashboard you just built. Click ‘email’ in the sub-navigation under the dashboard title, an email configuration window will open.
- Input the email addresses for the recipients and be sure to separate multiple addresses with a comma.
- Set the frequency to fit your reporting needs.
- Select the day of the week you wish to send the email on.
- Add a personal message.
Pro Tip: Under advanced options you can choose how long you want the automatic reporting to last for. I find it useful to set this at six months. This allows me to keep our reports current with client goals and KPIs that may change.
Pro tip: Set an appointment in your calendar on the date that the reporting expires. On this date, review the report to see if any goals or KPIs have changed, make necessary updates, and reschedule emails for another 6 months.
Import Three Ventures' Email Marketing Custom Dashboard For Google Analytics
To automatically import the email marketing custom dashboard from above, click this link and select the destination google analytics account to import it to..
Part Three Coming In April
How to take control of your marketing channels with Google Analytics focused on using the Google URL builder to import data into Google Analytics for segmentation. This post, How to visualize marketing channel data with Google Analytics, focused on how to plan out and build a custom dashboard that segments the marketing data captured from the Google URL Builder. Our next post, How To Proactively Monitor Marketing Channels With Google Analytics, will focus on spotting trends in marketing channel data, planning custom alerts based off of analysis of data segmentation, and implementing a custom alert plan to get automatic emails to help you monitor and manage marketing channels. All using Google Analytics. If you have any questions or comments, please share in the comments below. Three Ventures is more than willing to help passionate analytics professionals get the most out of the Google Analytics platform. Don't forget to share across your social networks and feel free to schedule a call with one of our Google Analytics Consultants to get help with your next analytics project. Need help optimizing your website or marketing machine? Get in touch with us.


